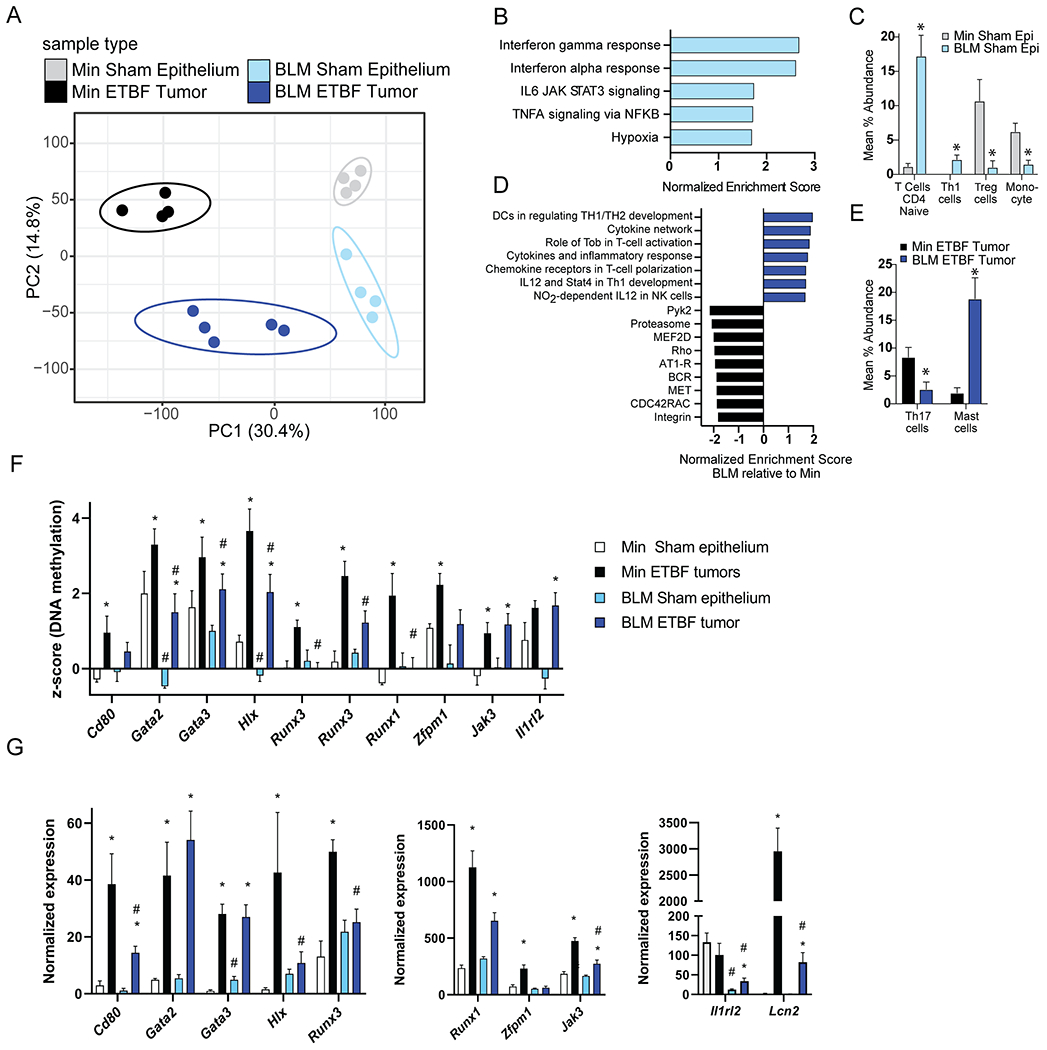
Figure 4. BRAFV600E mutation promotes an IFN-associated gene - expression signature in the normal epithelium and tumors of BLM mice.

RNA-seq analysis of colon epithelia (N=4) and individual tumors (N=4-5) collected from distal and mid-proximal regions of Min and BLM colons, respectively, 9-13 weeks post-inoculation. Epithelia samples are from 2 independent experimental cohorts. Tumors are from 6 independent ETBF inoculation cohorts. A) PCA analysis of all expressed genes. Unit variance scaling is applied to rows; SVD with imputation is used to calculate principal components. X and Y axes show PC1 and PC2 that explain 30.4 and 14.8% of the total variance, respectively. Prediction ellipses are such that with probability 0.95, a new observation from the same group will fall inside the ellipse. B) Normalized enrichment score from GSEA of mid-proximal BLM versus distal Min sham epithelium using all genes from the RNA-seq data and Hallmark gene sets. All pathways with an FDR < 0.01 are listed (none were enriched in Min sham epithelium). C) Differential abundance results based on CIBERSORT to predict immune cell composition per RNA-seq sample. Bar graphs represent mean ± SEM of immune cell types with significant differences (*P < 0.05 by t-test) in BLM sham epithelium (Epi) compared to Min sham epithelium. D) Normalized enrichment score from GSEA of ETBF-induced mid-proximal BLM versus distal Min tumors using all genes from the RNA-seq data and gene sets derived from the BioCarta pathway database. All pathways with an FDR < 0.05 are listed. E) Differential abundance results based on CIBERSORT as in C for ETBF-induced BLM versus Min tumors. F) Mean ± SEM of DNA methylation levels (Z-scores) from MBD-seq data of indicated genes. N=3-4 epithelium. N=5-6 tumors. *P < 0.05 relative to respective sham epithelium. #P < 0.05 relative to respective Min sample. G) Mean ± SEM of normalized expression from RNA-seq data of indicated genes. N=4-5. *,# as in F. Color key is consistent for all panels: grey=Min Sham epithelium, black=Min ETBF tumor, light blue= BLM sham epithelium, dark blue=BLM ETBF tumor.
