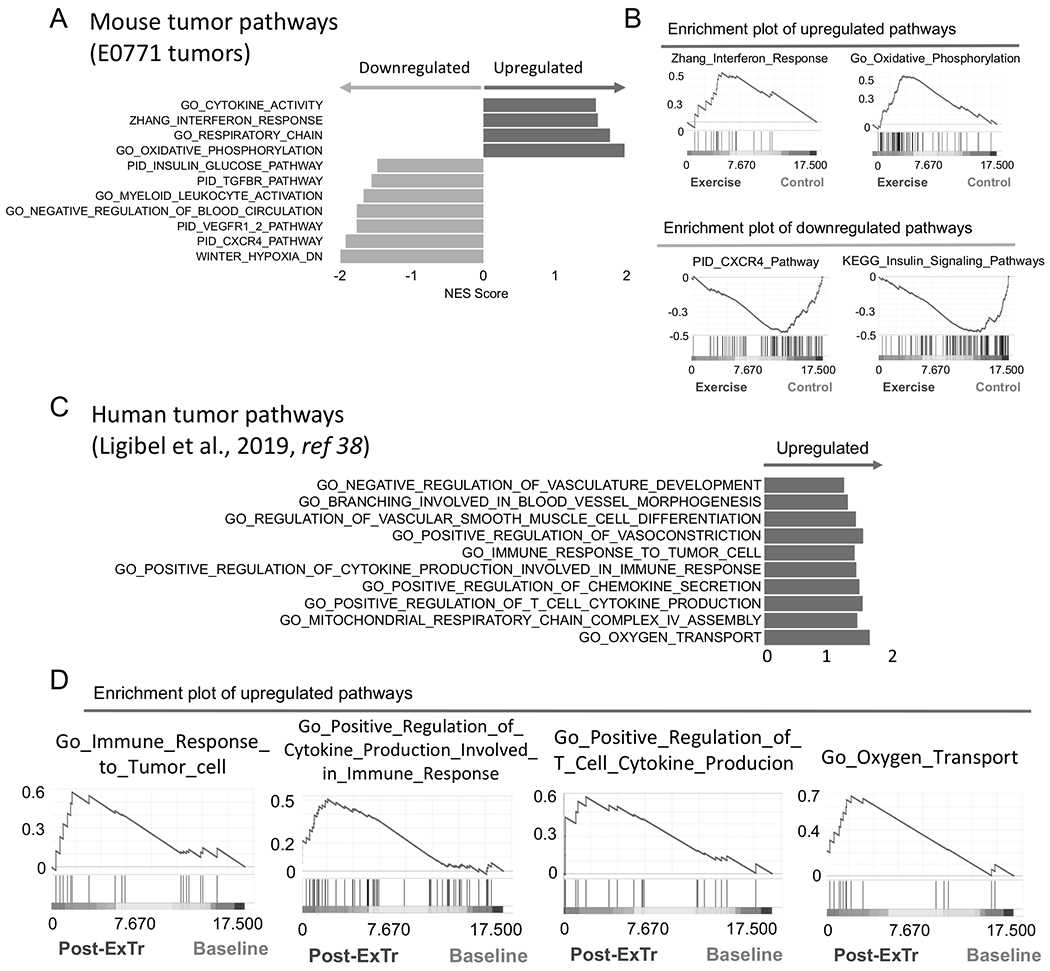
Figure 3. Exercise training reprograms the transcription profile in the TME of breast tumors.

A–B, RNA-seq analysis of bulk tumors showing effects of ExTr signaling pathways. (A) Horizontal bars indicate NES (Normalized Enrichment Score) of pathways upregulated (positive NES, in dark color, right) or downregulated (negative NES, in light color, left) by ExTr, indicated by Gene Set Enrichment Analysis (GSEA). (B) Representative GSEA plots showing enhanced molecular signatures. E0771 tumors, collected after 7 days of ExTr. n=5 mice per group, FDR (false discovery rate) q-value<0.12, p<0.05. Comprehensive list of pathways modulated by ExTr are included in the Supplementary section (Supplementary Fig. S5, Supplementary Table S1). C–D, Gene signatures of pathways related to antitumor immunity and vessel normalization in patients in response to ExTr. Original data set from Ligibel et al. (38).
