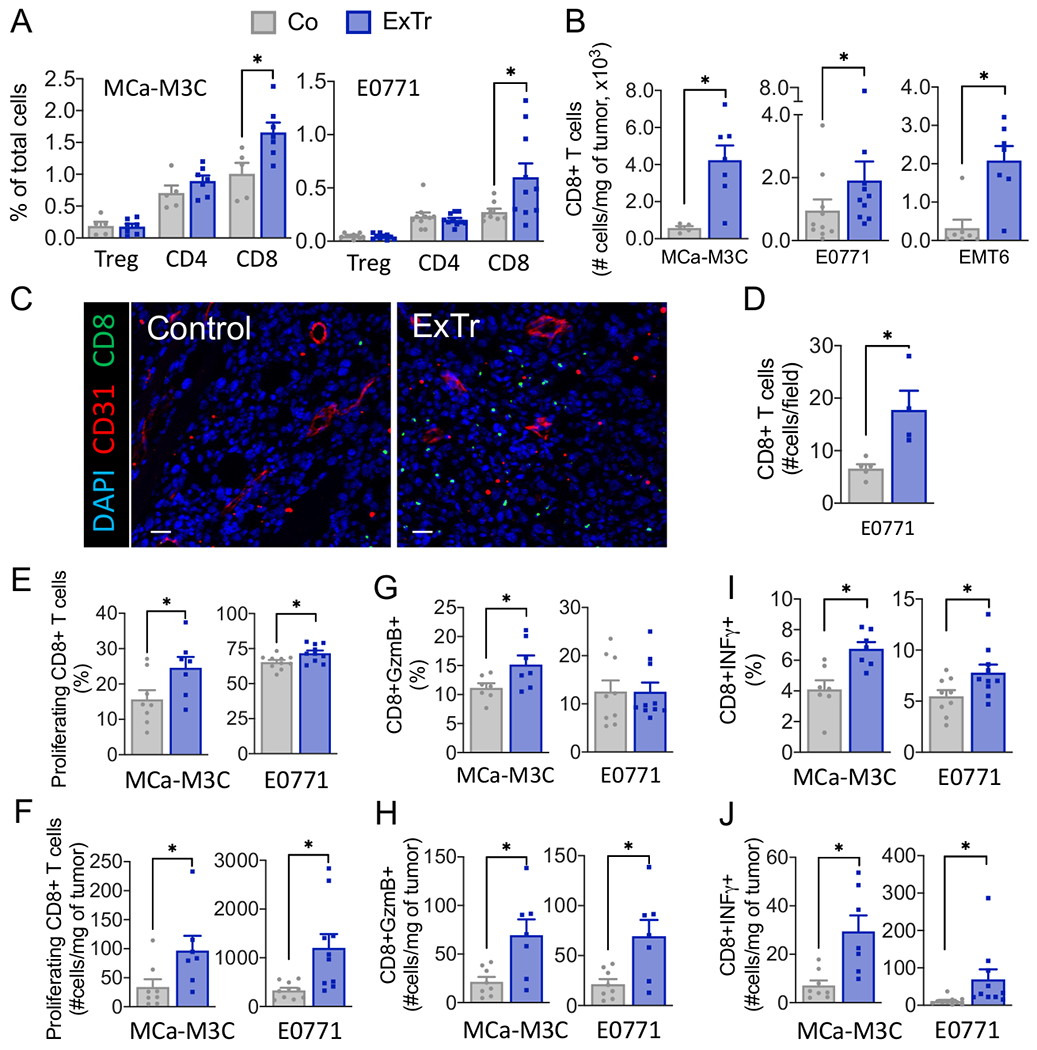
Figure 4. Exercise training improves infiltration and effector function of CD8+ T cells in breast tumors.

A, Flow cytometric analysis of tumor infiltrating TCR+CD4+FOXP3+ (Tregs), TCR+CD4+, and TCR+CD8+ T cells, assessed as percentage of total cells in breast tumors. B, Number of CD8 T cells in the three BC models. C, Representative immunofluorescence image [red indicates vessels (CD31+) and green indicates CD8+ T cells] and quantification of tumor immunohistochemistry images of CD8+ T cells per field. Scale bar, 25 μm (n=5 mice per group). D, Absolute number of CD8+ T cells per field. E–J, CD8+ T-cell functions. (E, H) Proliferating (Ki67+) CD8+ T cells. (F, I) Granzyme B+ and (G, J) IFNγ+ CD8+ T cells. For flow cytometry, 2 to 3 independent experiments were performed, and the results are representative of one single experiment (n=6-10 mice per group). Statistical differences comparing groups by unpaired Student’s t test. Data presented as mean ± SEM.
