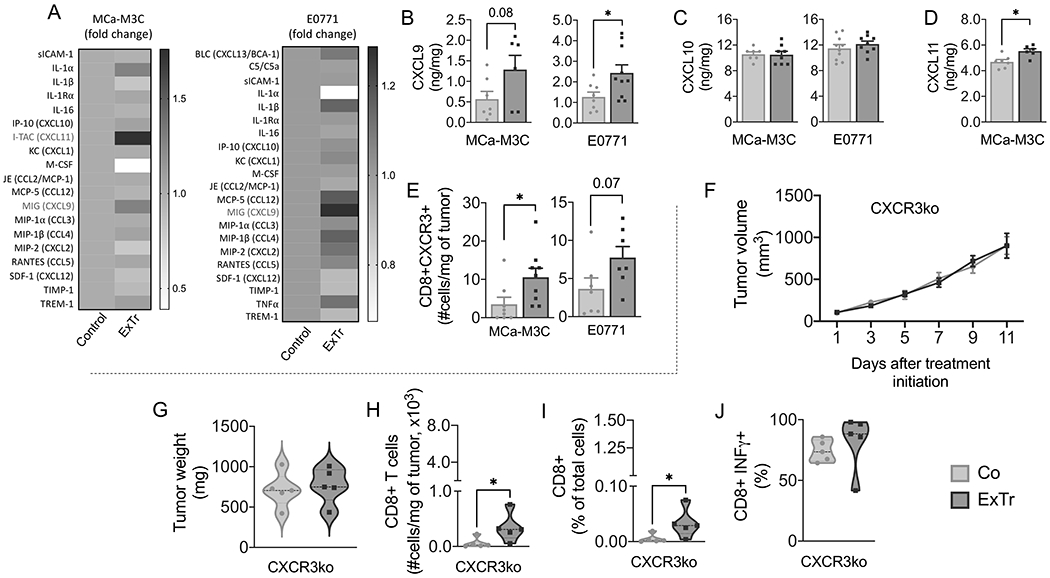
Figure 6. CXCL9/11-CXCR3 pathway is required for the CD8+ T cell-mediated antitumor effect of exercise training.

A, Heat map of cytokine array on MCa-M3C and E0771 tumors (pooled samples from n=6 mice per group). B–D, ELISA of chemokines (B) CXCL9, (C) CXCL10, and (D) CXCL10 in bulk tumors after 7 days of ExTr (n=6-10 per group, samples run in duplicate). E, Absolute number of CXCR3+CD8+ T cells for both MCa-M3C and E0771 tumor models (flow cytometry). (F-G) We implanted E0771 tumors in Cxcr3−/− mice (C57BL/6 background). When tumors reached ~100 mm3, mice started ExTr (daily sessions at 60% of maximal exercise velocity for 11 days) or were kept sedentary. (F) Tumor growth and (G) final tumor weight in Cxcr3−/− mice. (H) total and (I) relative tumor infiltration of CD8+ T cells in Cxcr3−/− mice. (J) CD8+ T-cell expression of IFNγ in both groups. n=5 mice/group. Statistical differences by comparing groups by unpaired Student’s t test (B-E), two-way ANOVA (F), and Mann-Whitney test (G-J). Data presented as mean ± SEM or median ± interquartile range and distribution (violin plot, G-J).
