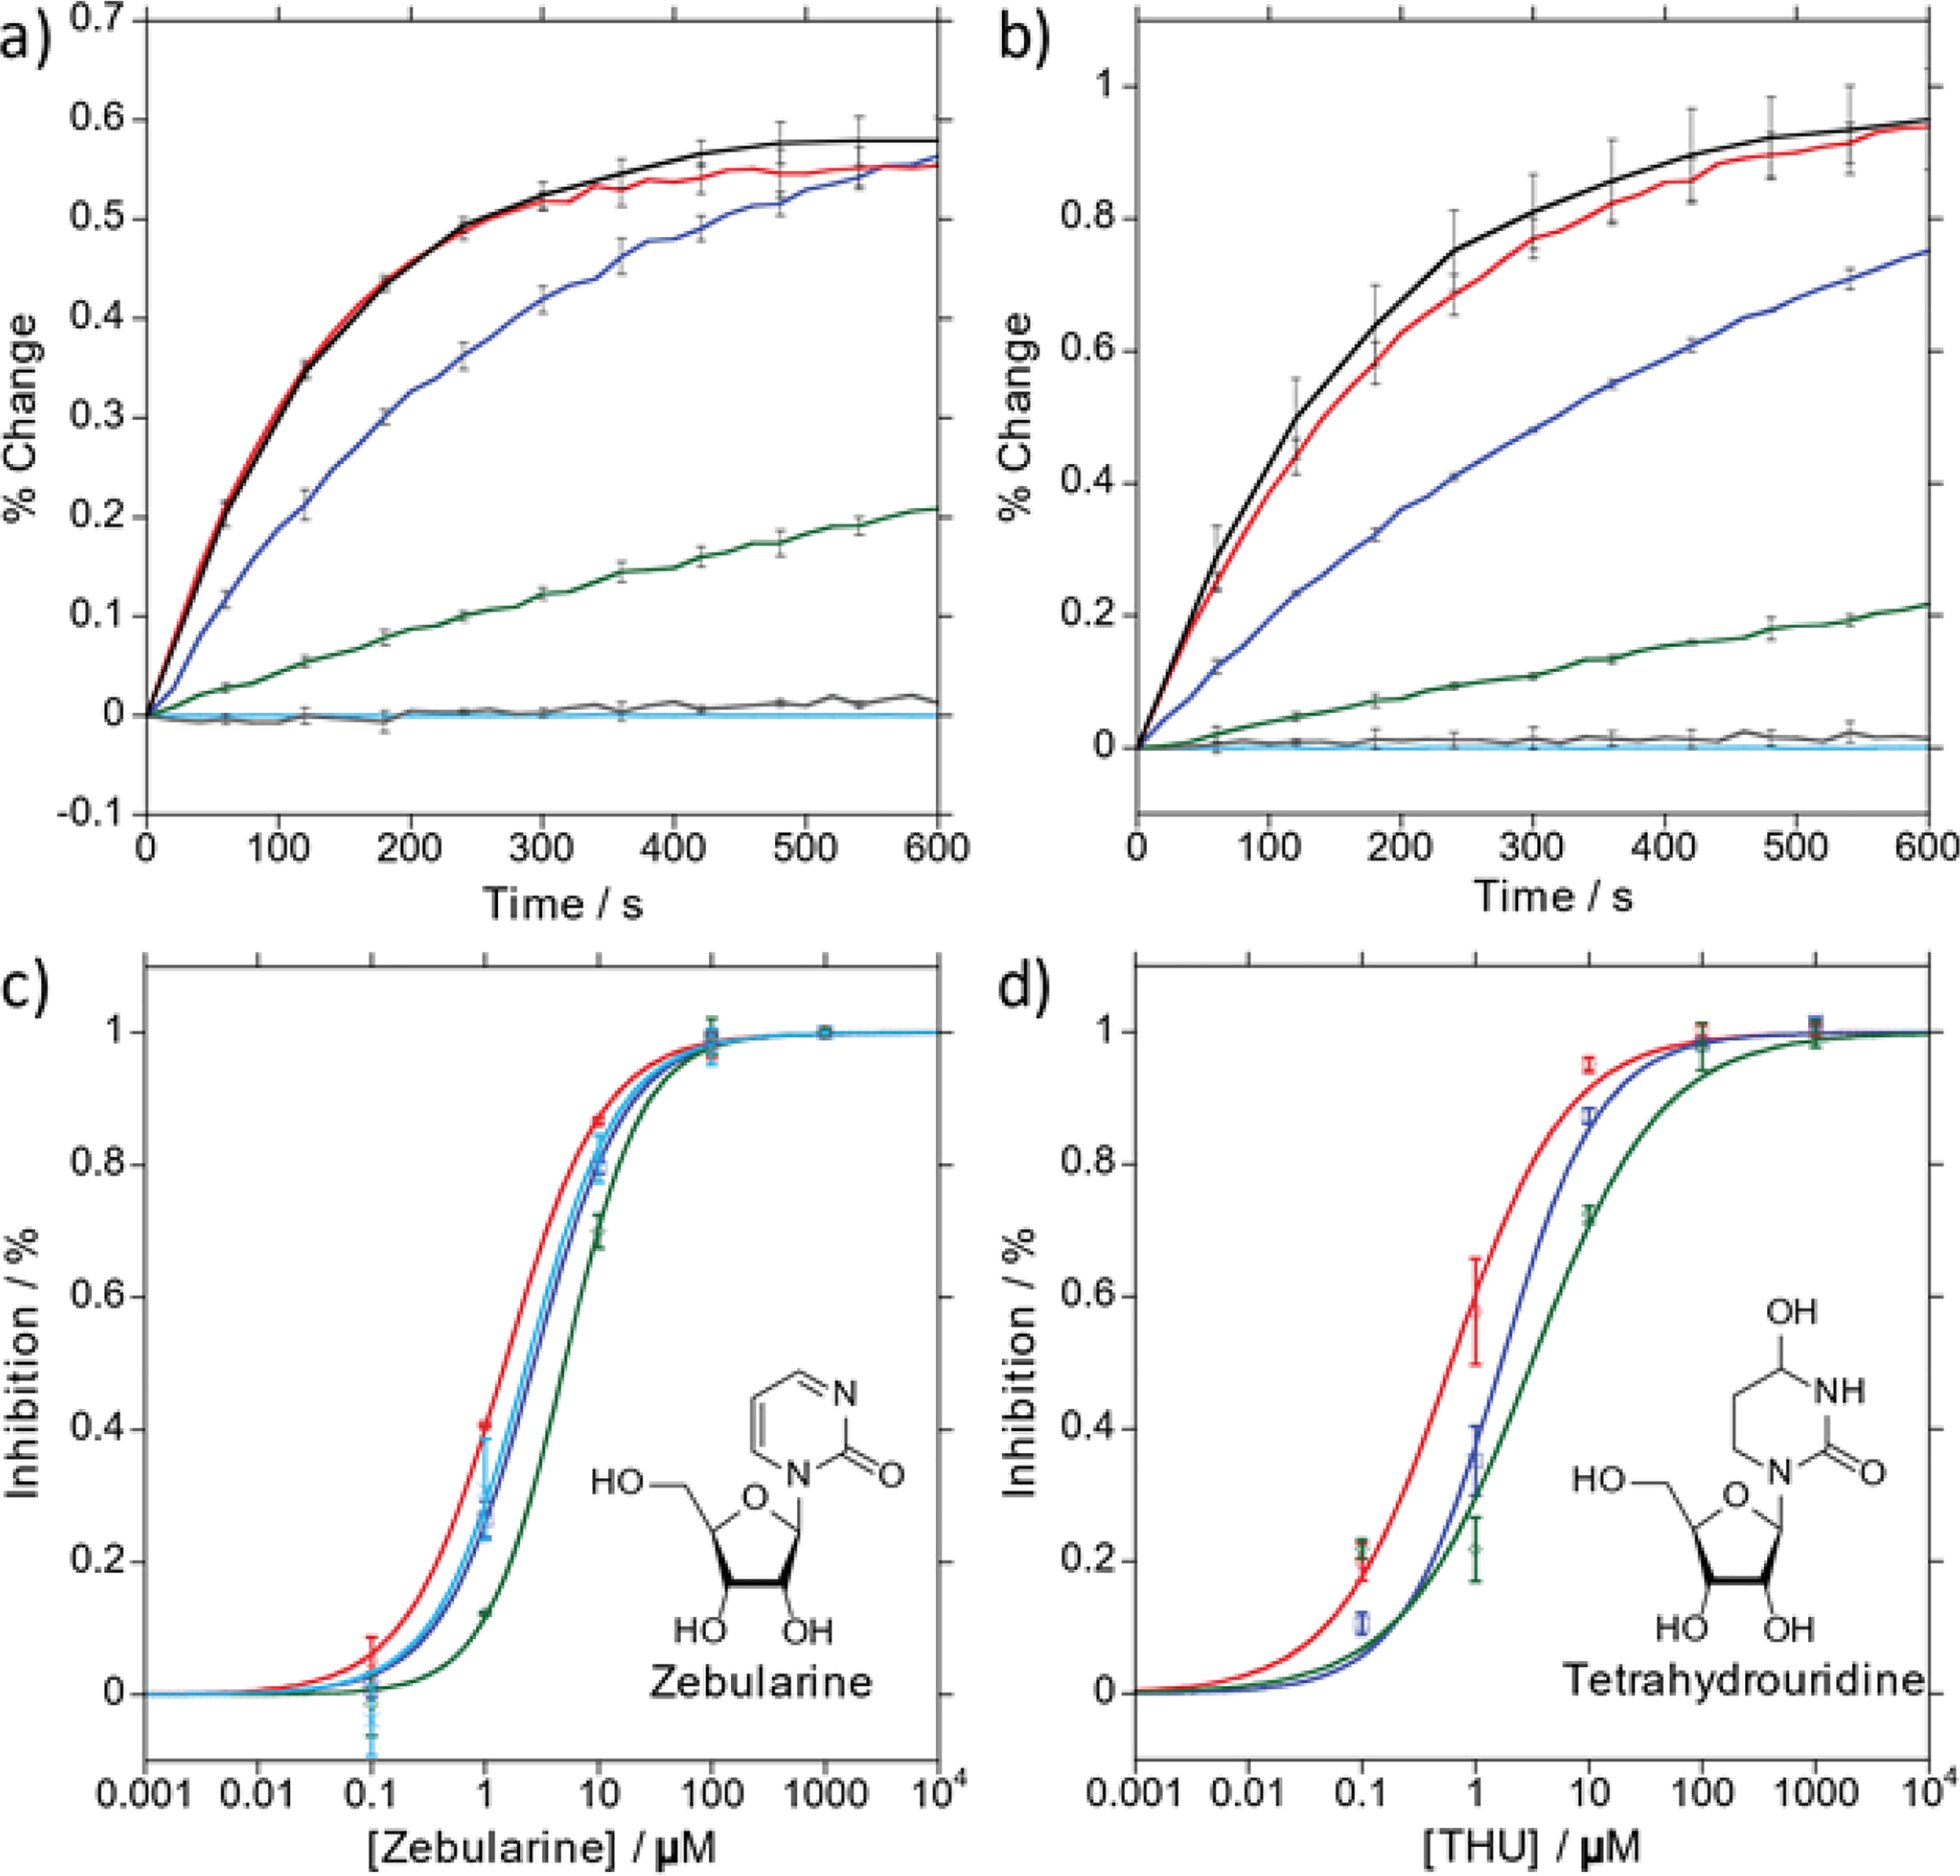
Figure 4.

a, b) Conversion of thC to thU (a) and mthC to mthU (b) in the presence of various concentrations of Zebularine ([I] = 0 μM (black), 0.1 μM (red), 1 μM (blue), 10 μM (green), 100 μM (grey), 1 M (light blue). c, d) Semi-log plot of % inhibition in decimal form after 4 (thC) or 5 (tzC, mthC) minutes versus [Zebularine] (c) or [THU] (d) fit to a sigmoidal Hill curve: tzC (green), thC (blue), mthC (red), mthC with 100 μM Adenosine (light blue).
