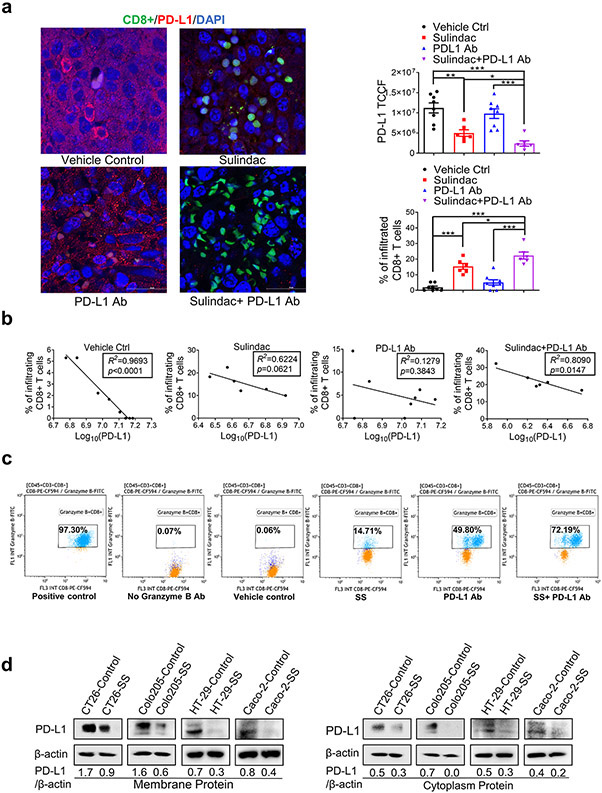
Figure 2. Sulindac increases the infiltration of CD8+ T lymphocytes in tumor tissues by down-regulating PD-L1 expression.
(a) Immunofluorescence imaging results show that sulindac increases the infiltration of CD8+ T lymphocytes in tumor tissues and downregulates PD-L1 expression. Treatments include vehicle control, sulindac, PD- L1 Ab, and sulindac+PD-L1 Ab. Red: PD-L1; Green: CD8+ T cells; Blue: DAPI. PD-L1 expression and CD8+ T cell infiltration were quantified by ImageJ (v1.48, NIH). The total corrected cell fluorescence (TCCF) of PD-L1 was calculated using the formula: [TCCF = integrated Density - (area of selected cell × mean fluorescence of background readings). For CD8+ T cell infiltration, we calculated the percentage of CD8+ T cells in tumor tissues using the formula of the number of CD8+ T cells divided by the total number of surrounding tumor cells plus CD8+ T cells. Mice that died before the endpoint or lacked visible tumor mass treatment were not included in this analysis. Differences between the two groups were evaluated by Student’s t-test, * p<0.05, ** p<0.01, *** p<0.001. Images were taken with a Nikon Eclipse Ti2 Laser Confocal Scanning Microscope. (b) Linear correlation of PD-L1 expression levels and infiltrating CD8+T cells between the two groups was calculated with Prism GraphPad 7.0. The goodness-of-fit measurement, R2 was calculated to measure the strength of the predictor in explaining the outcome, and the p-value of coefficients in the linear models was used to report the significance of the predictor. (c) Additive/synergistic effect of sulindac and PD-L1 Ab on activation of CD8+ T lymphocytes. Splenocytes were prepared from the spleens of BALB/c mice and mechanically dissociated and filtered. Then we treated the splenocytes with 1 μg/ml anti-mouse CD3e antibody and 1 μg/ml anti-mouse CD28 antibody (positive control), 0.1% DMSO plus 200nM IgG2b (vehicle control), 25 μM SS, 200 nM anti-mouse PD-L1 antibody, and a combination of 25 μM SS and 200 nM anti-mouse PD-L1 antibody for 72 h, respectively. After treatment, cells were incubated with flow cytometry antibodies as described in Materials and Methods prior to the analysis with flow cytometry. (d) Sulindac sulfide (SS) downregulates PD-L1 expression in pMMR CRC cells. CT26, Coloa205, HT29, and Caco-2 cells were treated with 25 μM SS and vehicle control (DMSO) for 48 h, followed by isolation of cell membrane and cytoplasm from cell lysis. PD-L1 expression was evaluated using Western Blot, and the intensity ratio between PD-L1 and β-actin was calculated using Quantity One software (Bio-Rad).

