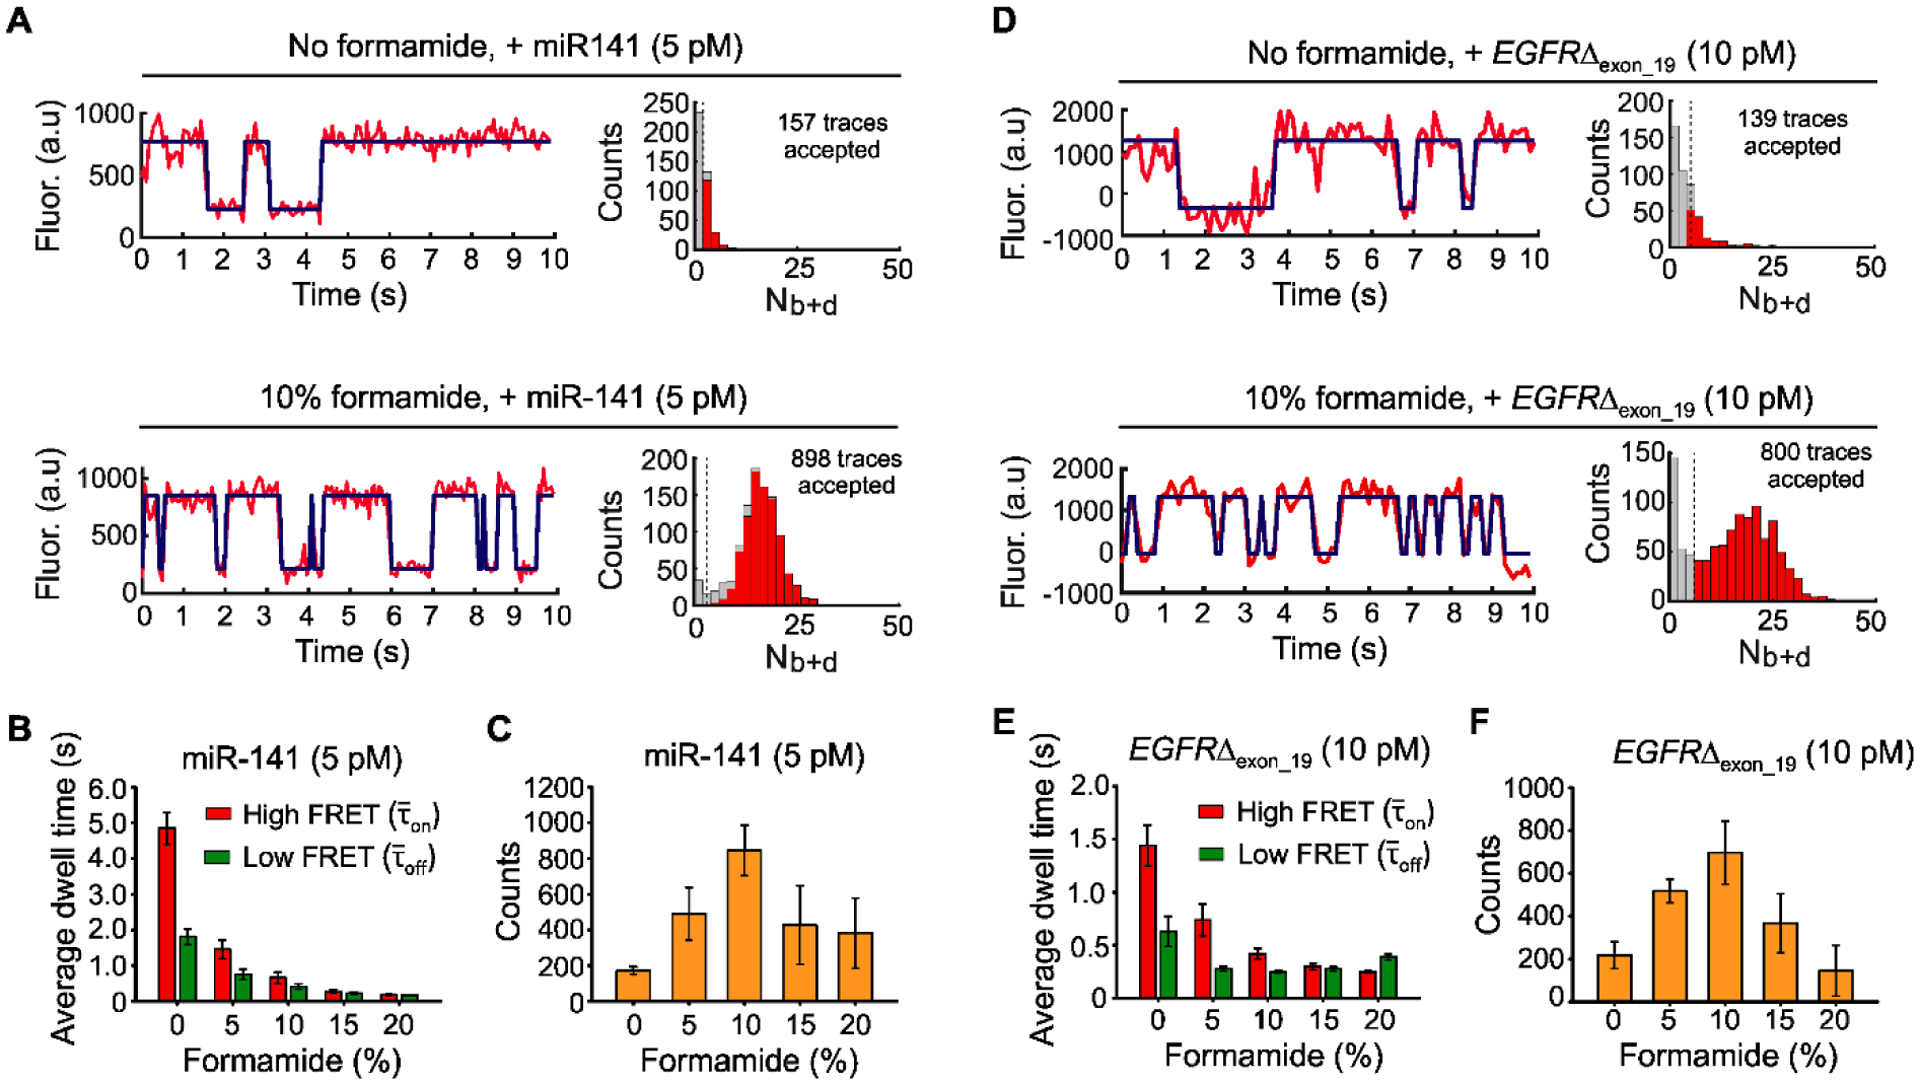
Fig. 4.

The effects of formamide on iSiMREPS sensors for rapid detection of miRNA and ctDNA. (A) Representative single- molecule kinetic fingerprints and histograms of the number of candidate molecules per FOV showing a given number of binding and dissociation events (Nb+d) after applying thresholds for FRET intensity, S/N, and dwell times of bound and unbound states in presence of 5 pM miR-141, without (top) and with 10% (v/v) formamide (bottom). The Q8C6QS18CS3 sensor as depicted in Figure 2A was used for this study and pre-treated with a capture invader (5´TCCGCCATATAACACTGTCTG 3´) and query invader (5´GAGTGTCCCGCGGCCCAGGA 3´) to remove non-target-bound sensors from coverslip before imaging under an objective-TIRF microscope. (B) The average dwell times for miR-141 bound state (high-FRET and non-bound state (low-FRET) as a function of formamide (0–20%, v/v). (C) The number of candidate miR-141 bound molecules per FOV as a function of formamide after applying an optimized kinetic parameter (see SI, and Table S6). (D) Representative single- molecule kinetic fingerprints and Nb+d histograms per FOV in presence of 10 pM EGFRΔexon_19 without (top) and with 10% formamide (bottom). Q8C6QS18CS19 sensor and invaders as depicted in Figure 3A were used for this study. (E) The and for EGFRΔexon_19 as a function of formamide (0–20%, v/v). (F) The number of candidate EGFRΔexon_19 bound molecules per FOV as a function of formamide after applying optimized kinetic parameters (see SI, and Table S7). All data are processed at a standard data acquisition of 10s. All data are presented as mean ± s.d., where n ⩾ 3 independent experiments.
