
Fig. 6.
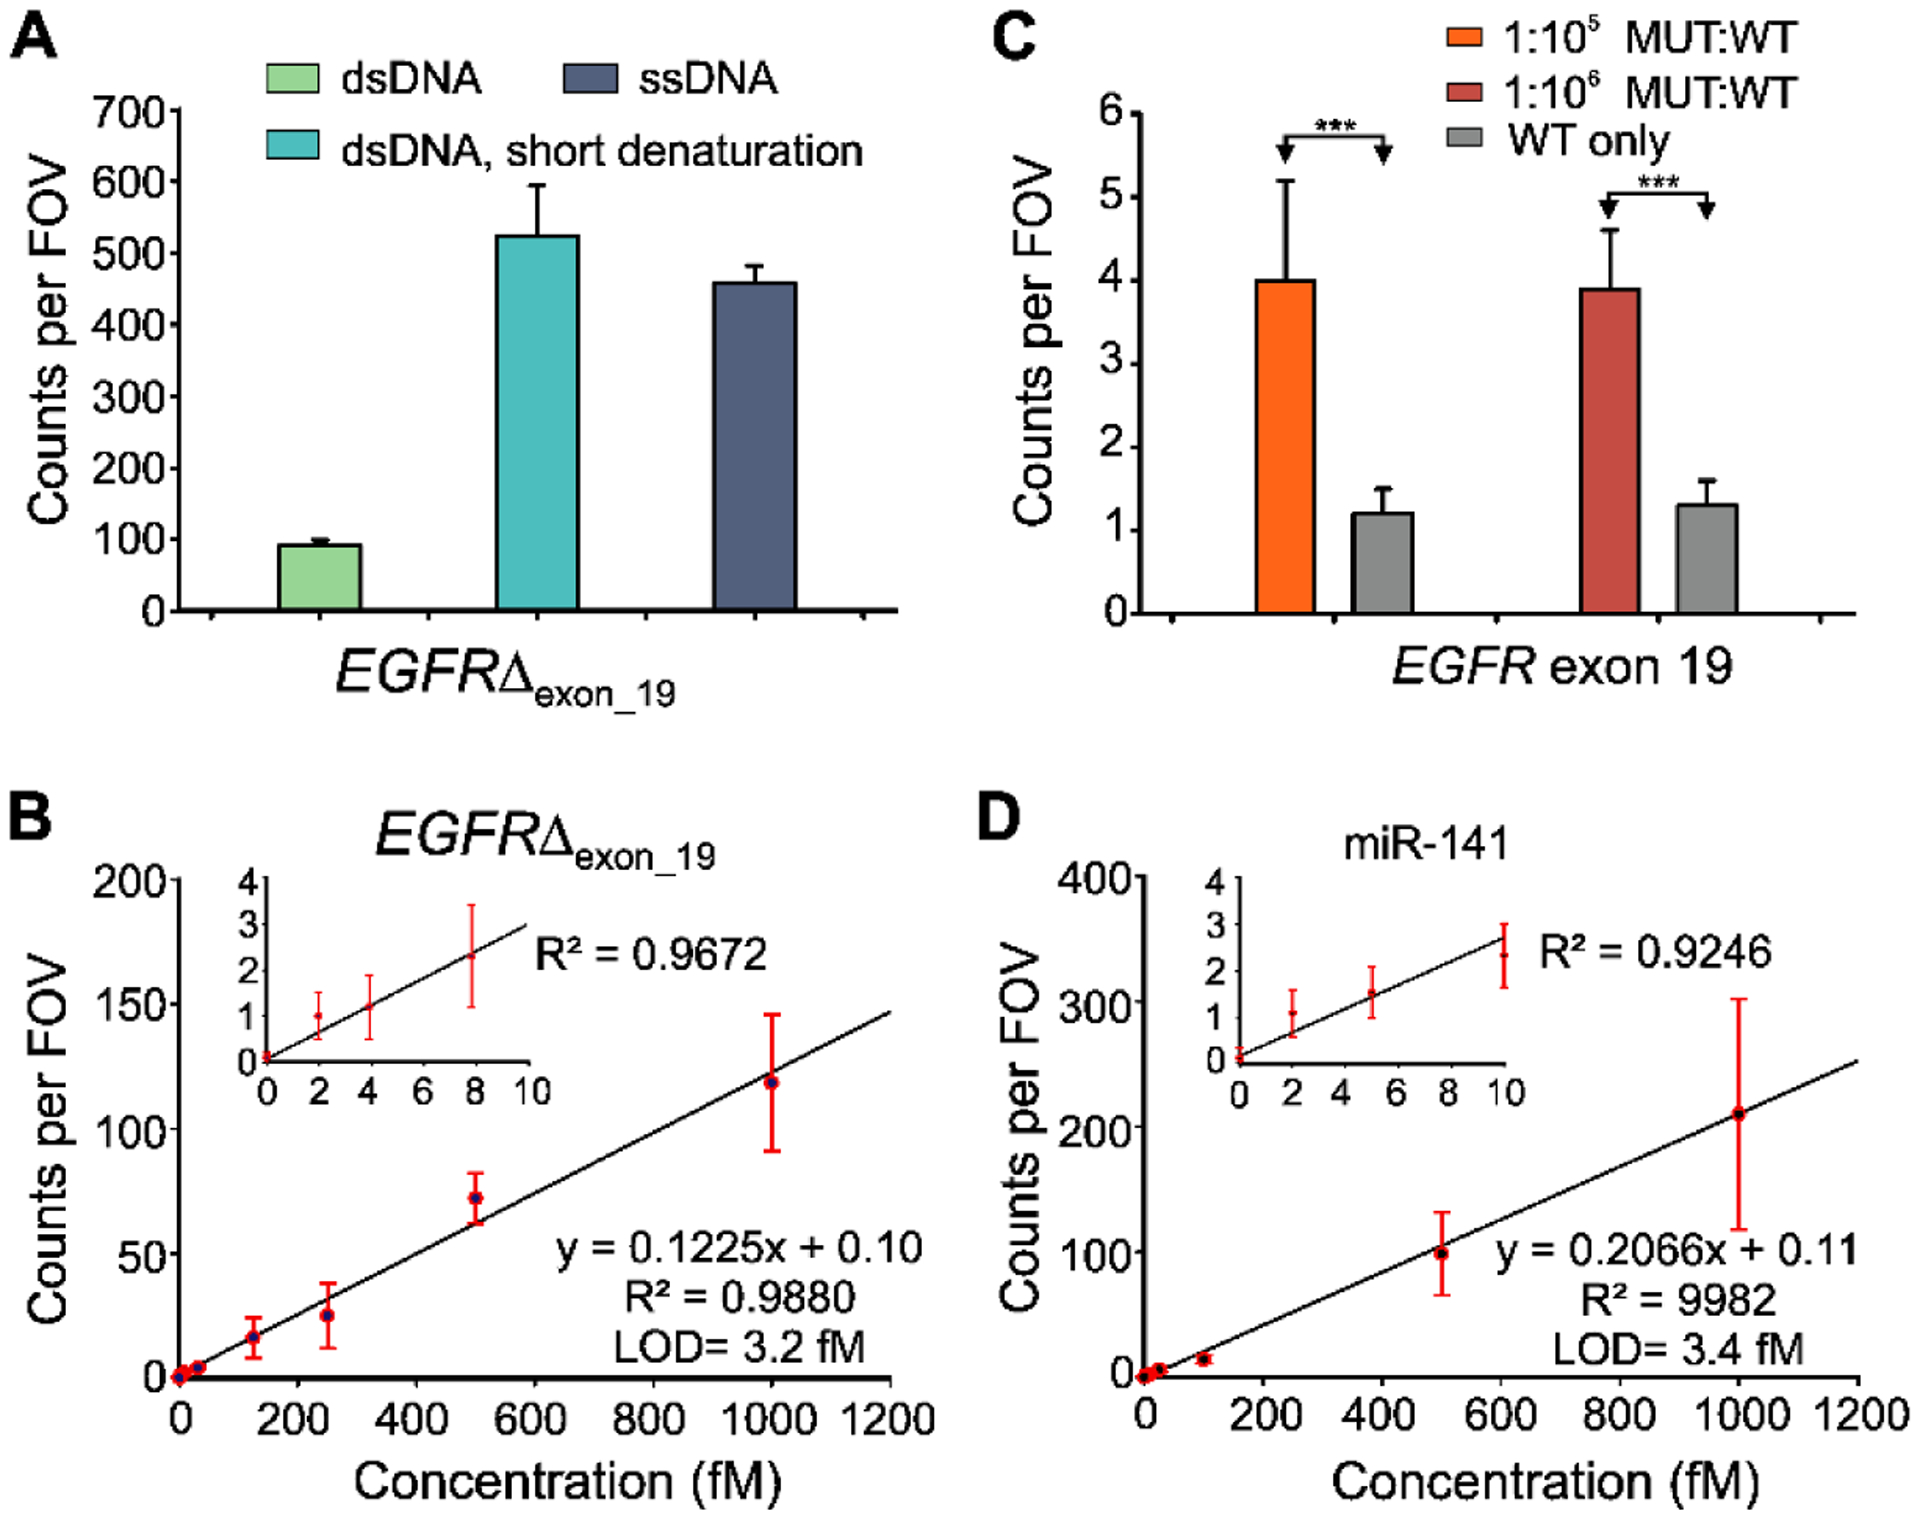
Standard curve and specificity of detecting EGFR exon 19 deletion (EGFRΔexon_19) and miR-141. (A) Effect of short thermal denaturation on the accepted counts of EGFRΔexon_19 duplex DNA (dsDNA). (B) Standard curve for EGFRΔexon_19 showing a LOD of 3.2 fM. Linear fits were constrained to a y-intercept of accepted counts at 0 fM. (C) Comparison of counts from low MUT allelic fraction and WT only conditions for determining specificity. Triple asterisks indicate the significant differences at 95% confidence levels as assessed using a two-tailed, unpaired t test and showed a specificity of 99.9996–99.9999% over the MUT fraction of 0.001–0.0001%. (D) Standard curve for miR-141 showing a LOD of approximately 3.4 fM. Linear fits were constrained to a y-intercept of accepted counts at 0 fM. All data are presented as mean ± s.d., where n ⩾ 3 independent experiments.