
Figure 6.
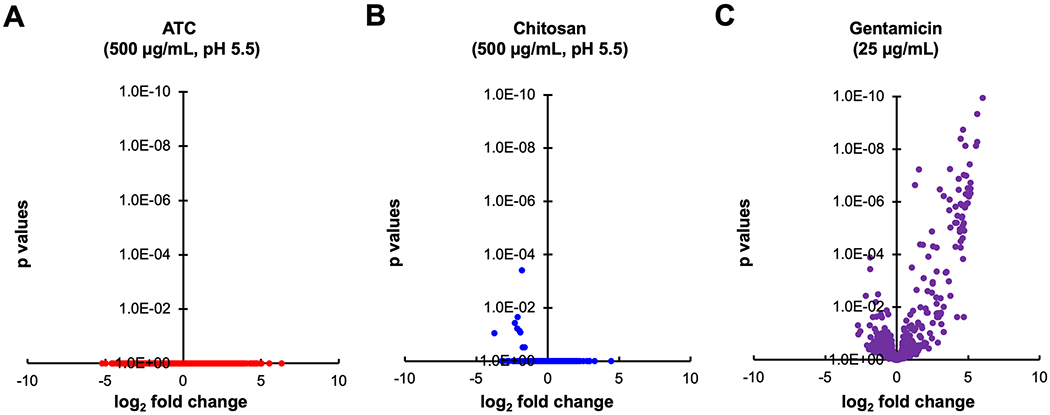
The effects of antimicrobial treatments on the representation of transposon mutants in complex S. Typhimurium Tn5 libraries. (A) Treatment with 500 μg/ml ATC for 1h at pH 5.5. (B) Treatment with 500 μg/ml chitosan for 1h at pH 5.5. (C) Treatment with 25 μg/ml gentamicin for 4h at physiological pH. See Experimental Section for experimental details. Data for (C) have been obtained with a lower complexity (125,000 mutants) library in S. Typhimurium 14028 Δhmp. Treatment conditions in (A) and (B) mimicked those where bacterial growth was found to be most suppressed (Figure 2A), although those tests had not been performed in growth medium. Volcano plots show the summed differences of Tn mutants per strand-specific genomic feature before and after treatment, and the statistical probability of regulation. A minimum of five transposon insertions per feature was required for inclusion in the plot. Data are from at least three biological replicates. All tested conditions for chitosan and ATC (dosages of 100, 500, and 1000 μg/ml, pH 5.5 or 7, logarithmically growing or stationary cultures) resulted in similar plots, with no statistically relevant dose-dependent effects observed on mutant representation in specific genes. Gentamicin affects representation of mutants in many genes at a much higher probability, compared with ATC or chitosan.