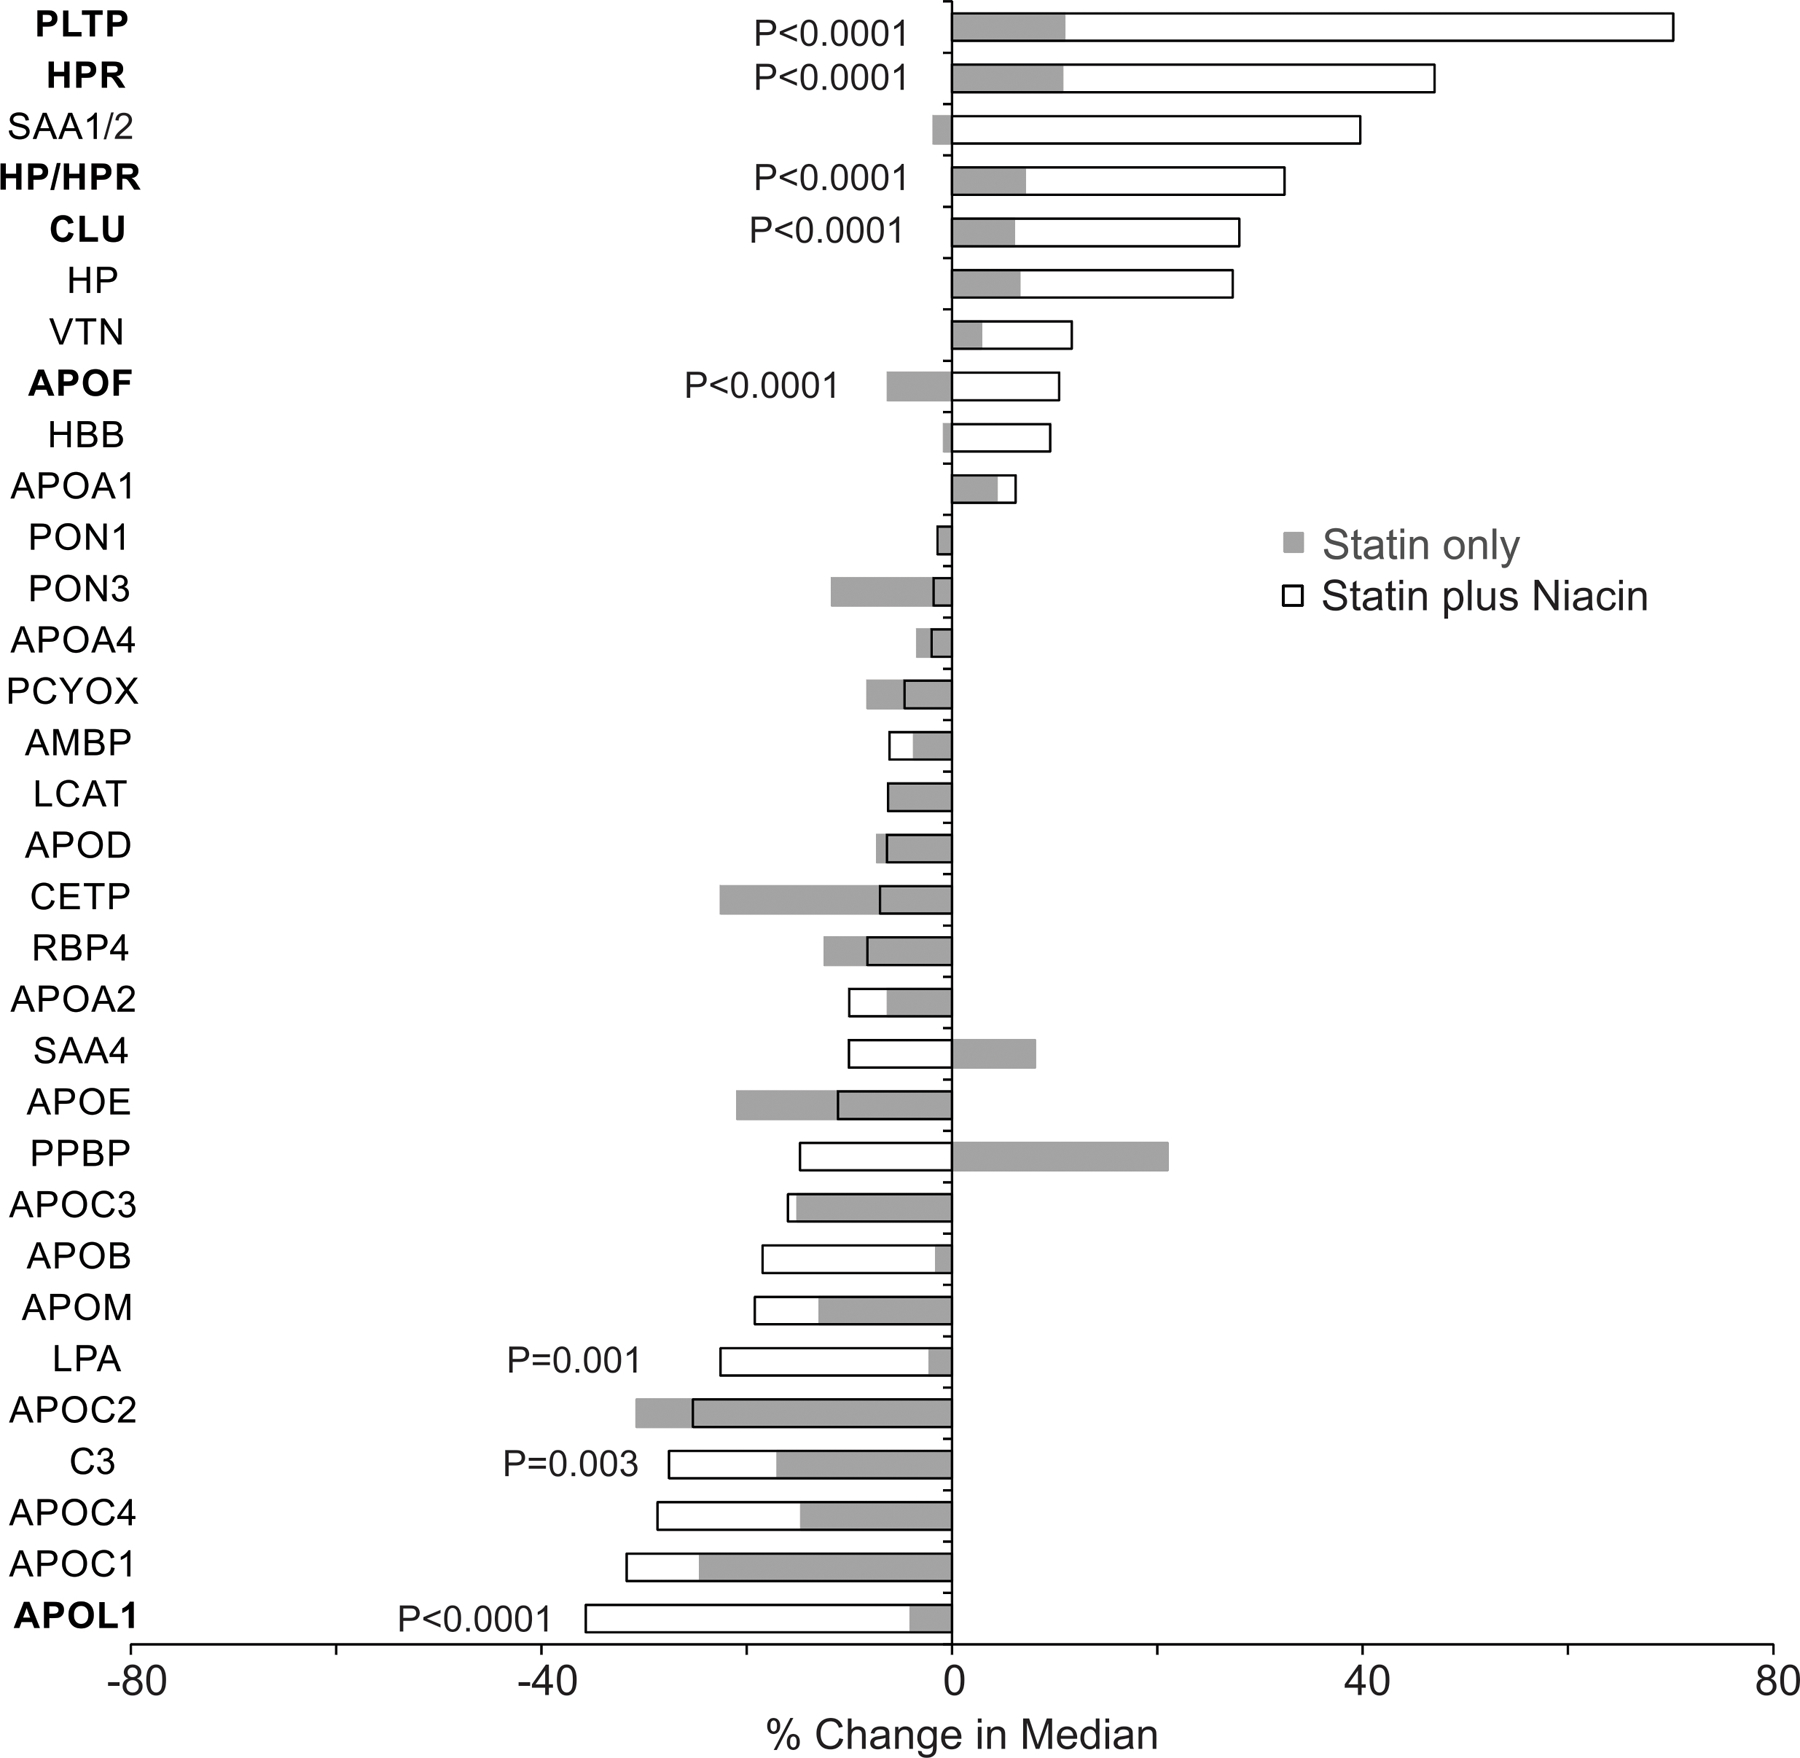
Figure 3. Changes in HDL protein amounts after 1-year on statin or niacin-statin therapy for CPC study subjects.

The differences in the changes between the therapies were compared using the Wilcoxon rank-sum test. P values were corrected for multiple comparisons using the method of Benjamini and Hochberg. P values of proteins with significant changes between therapies are shown. Proteins with P ≤0.0001 are in bold.
