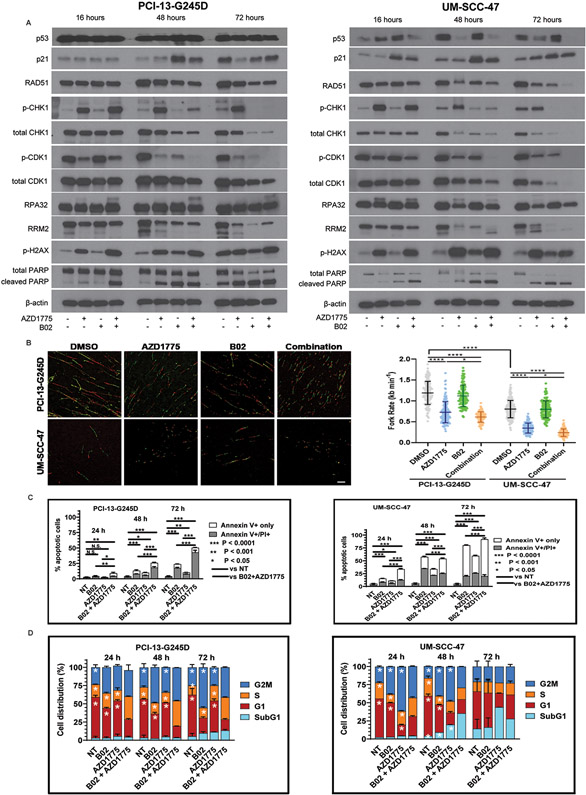
Figure 3. Synergistic interaction of B02 and AZD1775 is mediated in part through forced activation of CDK1 and inhibition of Chk1 associated with impaired Rad51-mediated homologous recombination repair in HNSCC cells.
PCI13-G245D and UM-SCC-47 cells were treated with B02, AZD1775, or in combination for 16, 48, 72 hours and protein lysates were subjected to western blot analysis with antibodies as indicated. A, levels of phosphorylation of Chk1 (S345), CDK1 (Y15), γH2AX (S139), RPA32, total p21, Rad51, Chk1, CDK1, RRM2. The presence of PARP-1 cleavage as marker of apoptosis is shown. The β-actin served as loading control. B, PCI13-G245D and UM-SCC-47 cells were treated with DMSO and drugs as indicated for 16 hours and then subject to DNA fiber analysis to quantify mean replication fork speed (rate). Lower speed indicates higher degree of replication stress. Scale bar, 10 μm. Data are mean±SD. C, Annexin/PI positive staining (percentage of dead cells) confirming induction of apoptosis in these cells following treatment with B02 and AZD1775. Unsynchronized PCI13-G245D and UM-SCC-47 cells were treated with B02, AZD1775 alone or in combination for various time points as indicated and subjected to cell cycle analysis. NT (no treatment) control. D, percentage of cell cycle distribution determined by flow cytometry was presented as bar graphs. An increase in S-phase and sub G1 fractions indicative of replicative stress and cumulative apoptosis respectively were observed over time. Data shown are representative of three independent experiments. *P< 0.0001; single treatment compared with combination treatment for cell cycle phases as indicated.

