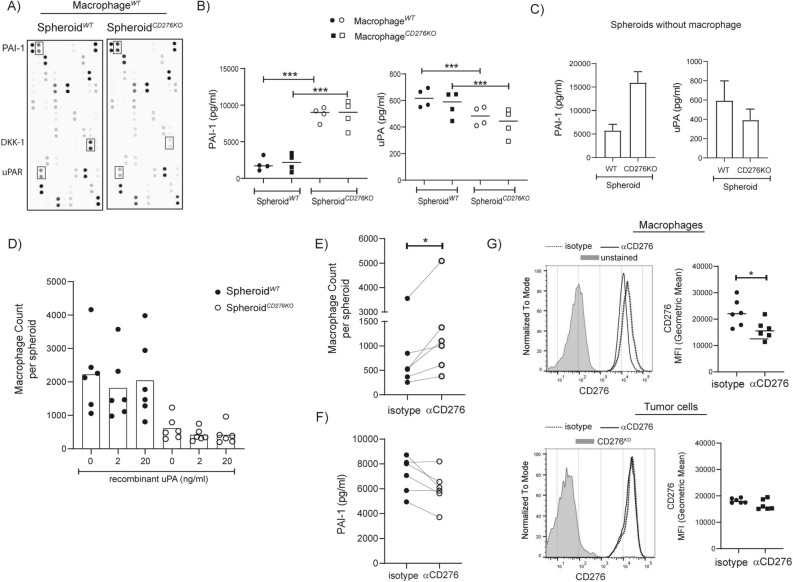
Figure 4.
In the absence of CD276 on tumor, soluble PAI-1 is increased, while uPA is decreased. (A&B) Spheroids formed from HCT116WT or HCT116CD276KO were cocultured with MacrophagesWT or MacrophagesCD276KO (M-CSF) for 4 days and supernatants were collected. (A) Proteome Profiler Cytokine Arrays from equal volume of supernatants from SpheroidWT or SpheroidCD276KO cocultured with the same MacrophagesWT are presented here. (B) The graphs summarize the concentration of PAI-1 and uPA in the supernatants performed with relevant ELISA for indicated samples. (C) Spheroids were cultured without macrophages for the same period (5 days after initial seeding + 4 days after medium exchange). To collect enough supernatant, 5 wells from each group were pooled into one sample. PAI-1 and uPA concentrations were analyzed with ELISA. The data is from three independent experiments. (D-F) Spheroids formed from HCT116WT or HCT116CD276KO cells were cocultured with macrophages (7 days cultured in M-CSF supplemented medium, no gene editing) for 4 days. Quantifications for CD11b+ infiltrated macrophages were done by flow cytometry. 6–10 spheroids from each group were pooled into one sample, and before dissociating the spheroids, a defined number of beads (negative compensation beads for flow cytometry) was added. The ratio of recorded bead counts to initial bead amount was used to back calculate MDMs per spheroid. (D) Spheroids and macrophages were cultured in the absence or presence of recombinant uPA protein with indicated concentration. Six macrophage donors in total were tested. (E–F) SpheroidWT cocultured with macrophages were treated with 20 µg/ml αCD276 antibody or isotype control. (E) Graph depicts the count of infiltrated macrophages per spheroid from six different donors. (F) The graph summarizes the concentration of PAI-1 in the supernatants from indicated samples (G) CD276 expression on macrophages and tumor cells treated with αCD276 antibody or isotype controls were analyzed. Histograms represent experiment with one macrophage donor and tumor cells in the same sample, and the graphs summarize the data from six donors and corresponding tumor cells. Dotted line indicates isotype treated controls, black line αCD276 antibody treated samples. Statistical analysis was done with paired t-test; **p < 0.01; ***p < 0.001.

