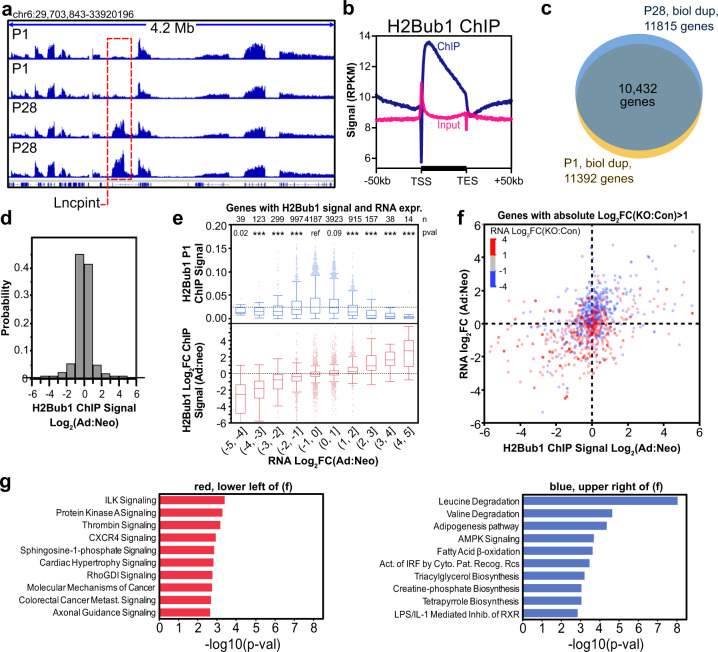
Fig. 5. H2Bub1 regulation of maturational gene expression.
a Representative genome browser view of neonatal and adult H2Bub1 ChIP-seq replicates. Dashed red box highlights a gene with dynamic H2Bub1 occupancy. b Profile plot showing average H2Bub1 signal at gene bodies. Plot shows gene bodies and 50 kb upstream of the TSS or downstream of the TSE. c Genes with detectable H2Bub1 ChIP-seq signal at P1, P28, or both timepoints. d Distribution of changes in H2Bub1 signal intensity during maturation, for all genes marked by H2Bub1 in at least one timepoint. e H2Bub1 P1 ChIP signal (top) or the change of H2Bub1 ChIP signal during maturation (bottom) as a function of the gene’s maturational change in RNA expression. The change in RNA was binned to contain the indicated range of log2 fold-change values. The change in gene expression correlated with the change in H2Bub1 occupancy, but not with the absolute H2Bub1 occupancy. Numbers at the top of plot (n) indicate genes per bin. Center lines in box plots indicate the median, while boxes show 25th and 75th percentiles. Whiskers denote the maximum observation within the 75th percentile +1.5 times the interquartile range, or the minimum observation within the 25th percentile −1.5 times the interquartile range. P-value: Steel–Dwass vs. H2Bub1 P1 ChIP signal in the (−1,0] bin; ***P < 0.001. f Maturational change in expression versus maturational change in H2Bub1 signal plotted for genes differentially expressed in RNF20/40-depleted CMs. Color indicates the direction of differential expression in RNF20/40-depleted CMs. Genes with maturational gain in H2Bub1 and RNA expression were predominantly downregulated in RNF20/40 depletion (blue, upper-right quadrant), whereas genes with maturational loss in H2Bub1 and RNA expression were mostly upregulated in RNF20/40 depeletion (red, lower-left quadrant). g Ingenuity pathway analysis of functional terms enriched amongst the indicated genes. Left: Red-colored genes in the lower-left quadrant of panel f (i.e., genes that decrease H2Bub1 and gene expression during maturation and are upregulated in RNF20/40 depletion). Right: Blue-colored genes in the upper-right quadrant of panel f (i.e., genes that increase H2Bub1 and gene expression during maturation and are downregulated in RNF20/40 depletion). P-values were calculated by IPA Core Analysis. Source data are provided as a Source Data file.

