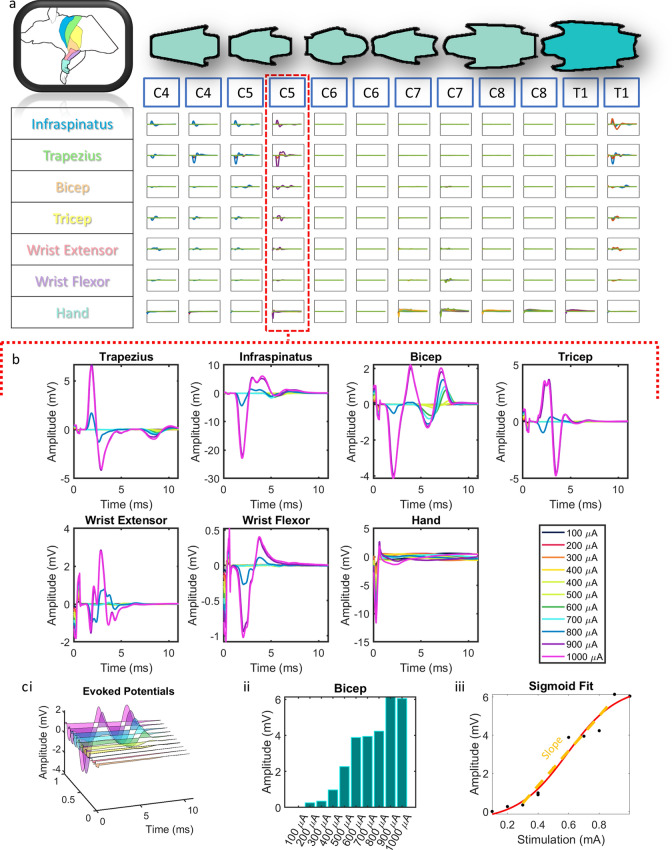
Figure 4.
Point-to-point EMG. (a) Grid of evoked potentials from each muscle at each stimulated position along the spinal cord using point-to-point stimulation. Each square is an overlap of all of the traces at each stimulation amplitude. Each overlapped trace is the average of 20 repeats. *all graphs in grid are from 0 to 12 ms on the x axis and − 18 to 18 mV on the y axis. (b) An expanded view of (a) for a single stimulation point at the C5 level. (c) (i) For each muscle at each stimulation position, we took the recruitment curves at increasing stimulation intensities (ii) and extracted the evoked response amplitude. (iii) Then, we used a sigmoid fit function to extract the slope of the resulting dose response curve.

