Figure 6.
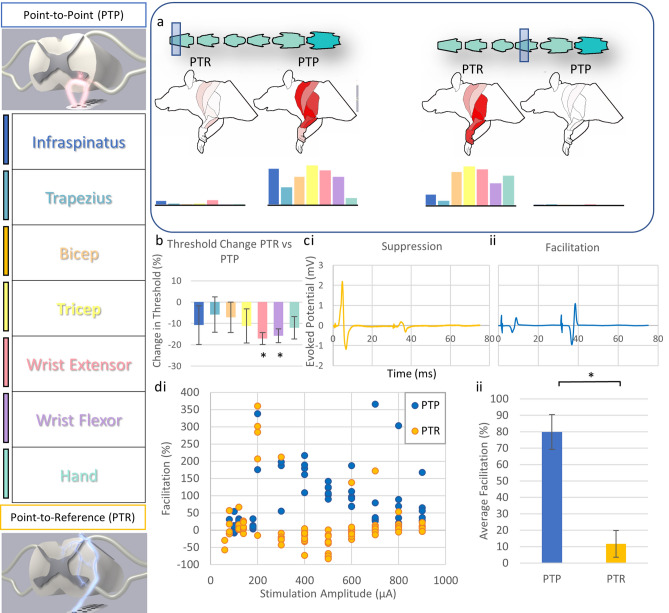
Modes of stimulation. (a) Examining the evoked muscle responses at each position along the spinal cord with both point-to-point (PTP) and point-to-reference (PTR) stimulation revealed positions where each mode induced distinct responses within the spinal cord. Each measurement demonstrates muscle activity at 400 µA constant current stimulation. The shaded box indicates the spinal level of stimulation and the intensity of red in the rat forelimb diagram indicates the level of activation of a given muscle group by relative muscle activity. This information is displayed below each diagram as a bar graph displaying muscle activity at each location normalized as a fraction from 0 to 1 where 1 is the maximal evoked response observed for each muscle at any stimulated position. (b) Thresholds were also affected by PTR vs PTP stimulation. For instance, at the C5/6 level, the thresholds of the wrist flexor and extensor were 15.7 and 17.1% lower respectively when stimulated at the same position in PTR vs PTP mode and there was a trend to lower overall thresholds in PTR mode. (c) Following a spinal stimulation doublet with a 30 ms interstimulation interval, we observed changes in the second evoked potential where the second amplitude was (i) lowered indicating signal suppression or (ii) raised indicating spinal facilitation. (d) (i) We analyzed the relative facilitation/suppression observed in both modes at various stimulation intensities and observed, (ii) PTP mode resulted in a greater degree of spinal facilitation.

