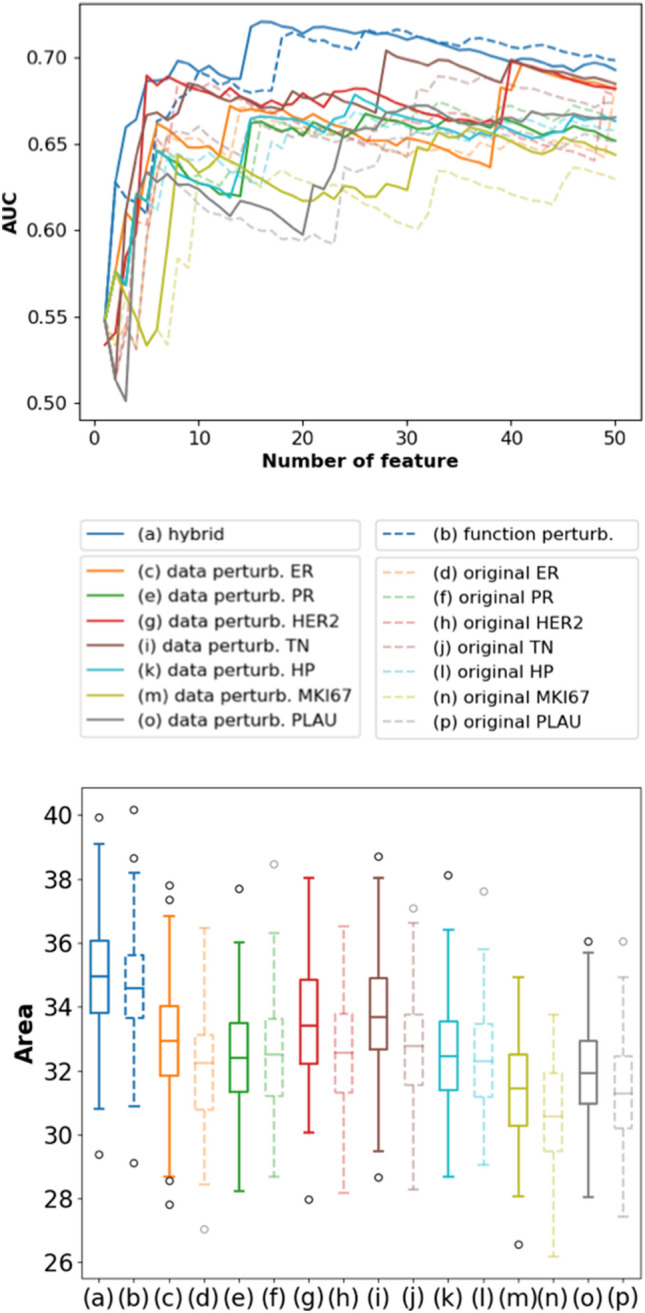
Figure 1.

Comparison of different ensemble approaches. (a–p) The random validation results of different feature selection approaches are presented. The curves on top represent the averaged validation AUC for the top-50 selected genes by different approaches. The boxes below represent the distribution of the "summarized areas" under the top-50 curves out of 100 random validations. Higher distribution implies better robustness since the selected genes have better performance in unseen validation data.
