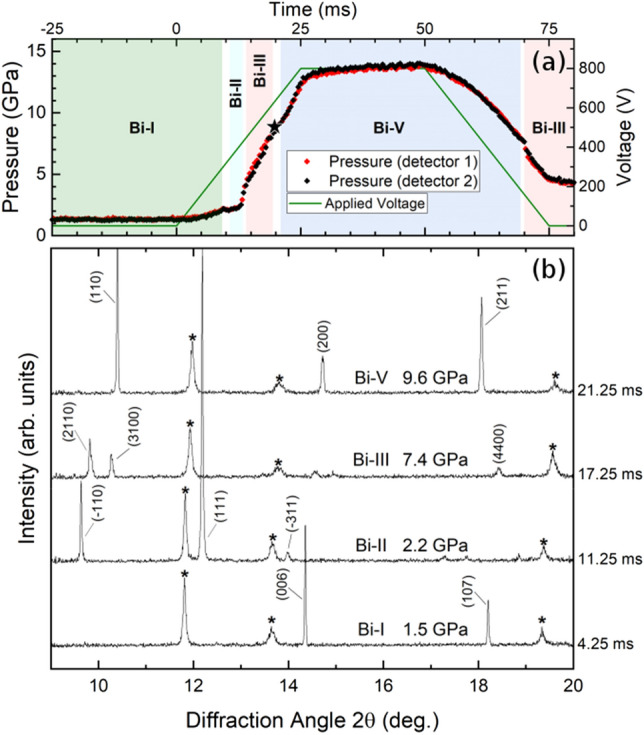
Figure 5.

(a) Compression profile, applied voltage and (b) integrated X-Ray diffraction profiles from a 25 ms compression ramp of a Bi foil sample without a PTM. Data were collected using a 0.5 ms exposure time. The shaded regions in (a) indicate regions in which single-phase Bi patterns were observed, and the star indicates the first appearance of Bi-V. Although not all of the Bi Bragg reflections are observed due to preferred orientation of the highly textured Bi foil, the different high-pressure phases are easily identified due to the emergence of new peaks at the phase transition. In (b), Bi reflections are labelled with their Miller indices, and peaks from the Au pressure marker are marked with an asterisk. The pressure is determined from Au, which is known to underestimate the sample pressure in this loading configuration (Au between the Bi sample and the diamond anvil, see Supplementary Methods).
