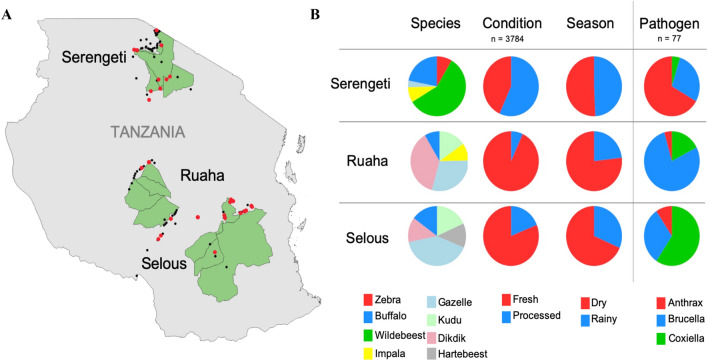
Figure 1.
Map and distribution of bushmeat samples collected from the three ecosystems in Tanzania. (A) Map of the sample collection sites. In the map, the three regions are shown in green. The points show the distribution of samples collected (black circles) and samples positive for one of the three pathogens (red circles). (B) Distribution of the collected bushmeat samples. The pie charts show the stratification of the collected bushmeat samples. For the species category (n = 3784), the top 5 most abundant species collected from the particular region are shown: Serengeti–Wildebeest (green), Buffalo (blue), Zebra (red), Impala (yellow), Gazelle (light blue); Ruaha–Dik-dik (pink), Gazelle (light blue), Kudu (light green), Impala (yellow), Buffalo (blue); Selous–Gazelle (light blue), Buffalo (blue), Dik-dik (pink), Kudu (light green), Hartebeest (grey). For the condition category (n = 3784), the red represents fresh samples and blue represents processed samples. For the season category (n = 3784), dry and rainy seasons are represented by the red and blue colors, respectively. The pathogen column (n = 77) shows the proportion of each pathogen from each region with B. anthracis shown in red, Brucella in blue, and Coxiella in green. The samples were collected from both dry and rainy seasons, Ruaha (dry; I = 1297; rainy = 391), Selous (dry = 813; rainy = 374), Serengeti (dry = 461; rainy = 448), and from two sample conditions, Ruaha (fresh = 1571; processed = 117), Selous (fresh = 962; processed = 223), Serengeti (fresh = 393; processed = 516). The map was generated using the QGIS Geographic Information System software. "QGIS Development Team (2019). Open-
Source Geospatial Foundation Project. Version 3.4.9-Madeira. http://qgis.osgeo.org".

