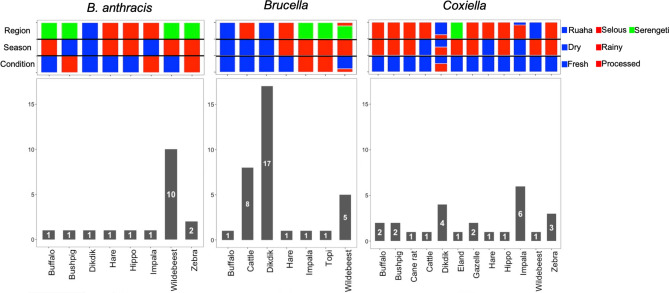
Figure 2.
Counts of Bushmeat Samples Positive for Select Agents. The count of positives for each species are included in the bar charts (with the total count in the bar with white font), separated by B. anthracis-positive in the left panel, Brucella-positive in the middle panel, and Coxiella-positive in the right panel. The coloring above the bar graphs show the proportion of samples within the species that are in each category (Region, Season, and Condition). The blue color represents samples collected from Ruaha, collected during dry season, and fresh samples. The red color represents samples collected from Selous, collected during Rainy season, and processed samples. The green color represents samples collected from the Serengeti. For instance, in the B. anthracis panel, one positive fresh (blue) buffalo sample was collected during rainy season (red), from Serengeti region (green).

