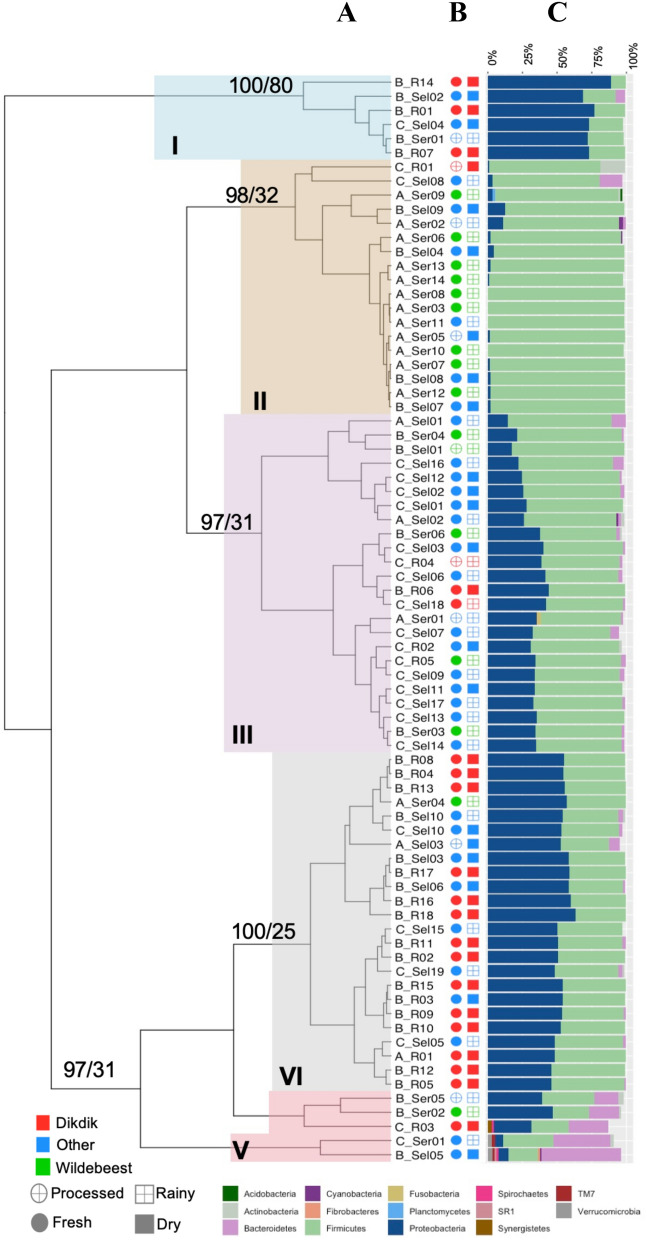
Figure 4.
Hierarchical clustering of the samples positive for one of the three pathogens based on the relative abundance of phyla in each sample. (A) Hierarchical clustering of samples. The samples grouped into 5 clusters: I—blue, II—tan, III—purple, IV—grey, V—red. The samples are labeled with the first letter representing the pathogen (A—B. anthracis, B—Brucella, C—Coxiella) and the ending representing the ecosystem (R—Ruaha, Sel—Selous, Ser—Serengeti). The AU/BP values for the clustering are shown at the base of each node. (B) Sample metadata. These columns show the other metadata associated with each sample. The open circles represent processed samples, and the closed are fresh samples. The open squares are from rainy season and the closed squares are from dry season. The shapes are colored according to species of wildlife from which the bushmeat originated: dik-dik—red, wildebeest—green, all other species—blue. (C) Bar graph of the relative abundance of phyla. The relative abundance of phyla > 1% is shown in the stacked bar graph. The colors corresponding to each respective phylum is in the legend at the bottom.

