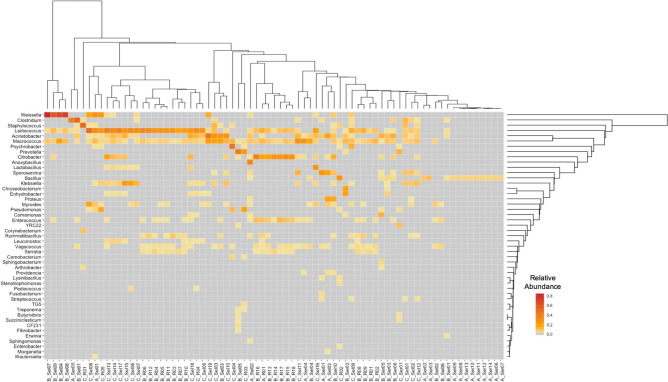
Figure 5.
Heatmap of the genus-level relative abundance in the samples positive for one of the three pathogens. The heatmap shows the relative abundance for any genus present at > 1%. The color ranges from pale yellow (low abundance) to dark orange (high abundance). Hierarchical clustering was performed for both the samples and the genera. The samples are labeled with the first letter representing the pathogen (A—B. anthracis, B—Brucella, C—Coxiella) and the ending representing the regions (R—Ruaha, Sel—Selous, Ser—Serengeti).

