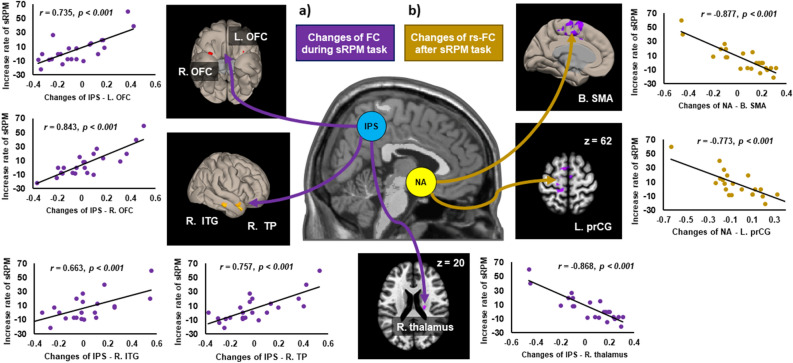
Figure 2.
Scatter plots showing the relationships between during-task (a) and post-task (b) changes in inter-regional functional connectivity (FC) and score increase rates of the short form of Raven’s Progressive Matrices (sRPM) in the self-respect group. rs-FC, resting-state functional connectivity; L. left, R. right, B. bilateral, NA nucleus accumbens, IPS intraparietal sulcus, SMA supplementary motor area, PrCG precentral gyrus, OFC orbitofrontal cortex, ITG inferior temporal gyrus, TP temporal pole.

