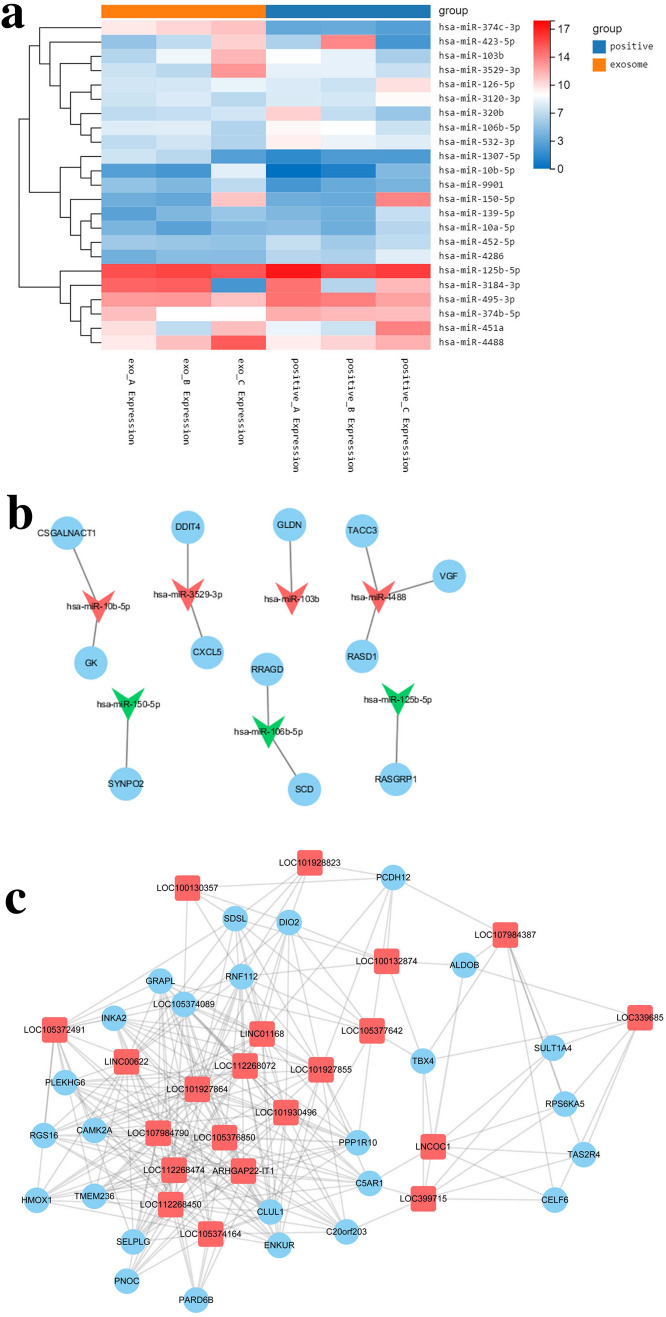
Figure 7.
HBMSC-derived exosomes modulate gene expression of hTMCs exposed to H2O2. (a) Heat map of 23 DE miRNA between Exo group and control group. The horizontal axis is log2 (expression value + 1) and the vertical axis is a gene. Line indicates DE miRNA, red indicates high expression, and green indicates low expression. (a) was drawn using R 3.6.3 for Windows (URL: https://cran.r-project.org/bin/windows/base/old/3.6.3/R-3.6.3-win.exe). (b) DEmiRNA-DEmRNA regulation network. Circle indicates DE mRNA, inverted triangle indicates DE miRNA, green indicates down-regulation and red indicates up-regulation. 12 miRNA-mRNA targeting pairs were predicted in the network. (c) Delncrna-DEmRNA interactional subnet. Square indicates lncNRA, Circle indicates mRNA. The data of microRNA, LncRNA and mRNA were presented in Supplementary Tables S6 and S7. (b,c) were drawn using Cytoscape 3.7.2 (URL: https://github.com/cytoscape/cytoscape/releases/download/3.7.2/cytoscape-3.7.2.zip).

