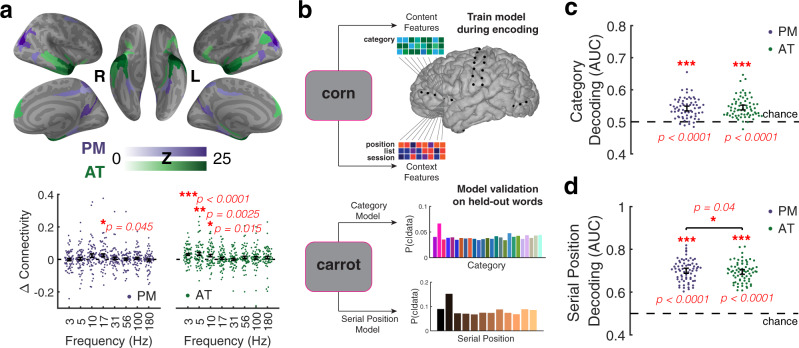
Fig. 2. Network-based decoding of content and context.
a rsfMRI connectivity identifies distinct cortical networks. Top: Functional connectivity (Fisher Z) to cortical targets of the PM and AT networks across right (R) and left (L) hemispheres. Bottom: Difference in connectivity of recording sites within versus between the two networks. Frequency specificity was observed within each network. b Modeling schematic. Ridge regression modeled evoked neural activity during stimulus encoding. Models were validated by decoding the category and serial position of held-out stimuli during encoding. c Reliable category decoding in the PM and AT networks during encoding. d Accurate serial position decoding for the PM and AT networks during encoding. Statistical inference was performed with two-sided, permutation t tests versus zero with FWER correction for multiple comparisons (a) or with one-sided sign tests versus chance (c, d). For all tests, n = 69 subjects. Data are presented as mean values ± SEM. *p < 0.05, **p < 0.01, ***p < 0.001. Source data are provided as a Source Data file.

