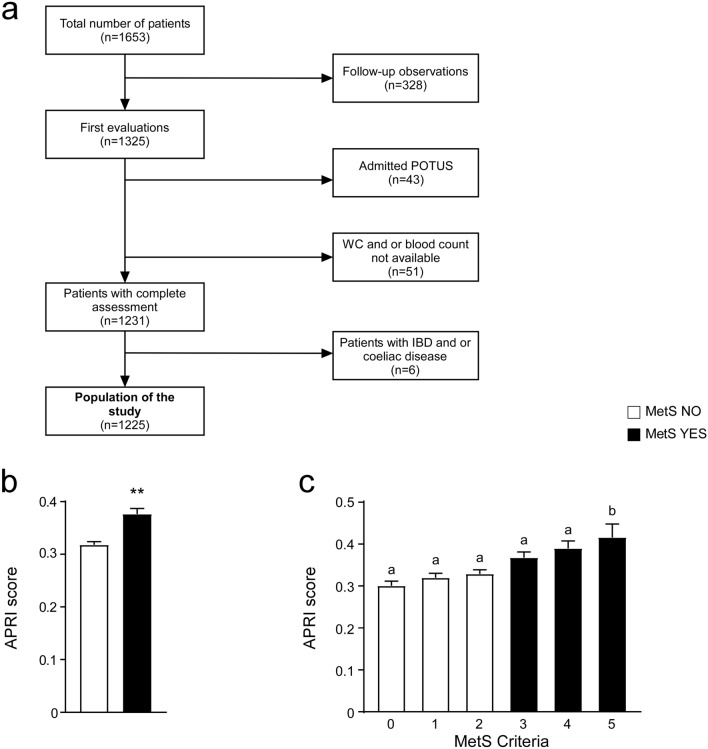
Figure 1.
Flowchart of study population and graphic representation of APRI score values. (a) Flowchart of the study population. (b) T-Test comparison of entire study population. Subjects categorized based on Metabolic Syndrome (MetS) diagnosis; non-metabolic (MetS NO) subjects = n.685, MetS (MetS YES) patients = n.540. Data is presented as mean ± SEM; **p < 0.01. (c) Comparison of APRI levels. Subjects were categorized based on positivity for MetS criteria. 0 criteria = n.186, 1 criterion = n.240, 2 criteria = n.259, 3 criteria = n.283, 4 criteria = n.171, 5 criteria = n.86. Data is presented as mean ± SEM. Comparison of groups was performed using one-way ANOVA test followed by Bonferroni’s post-hoc test. Data from groups sharing the same lowercase letter were not significantly different, whereas data from groups with different case letter were significantly different (p < 0.05).

