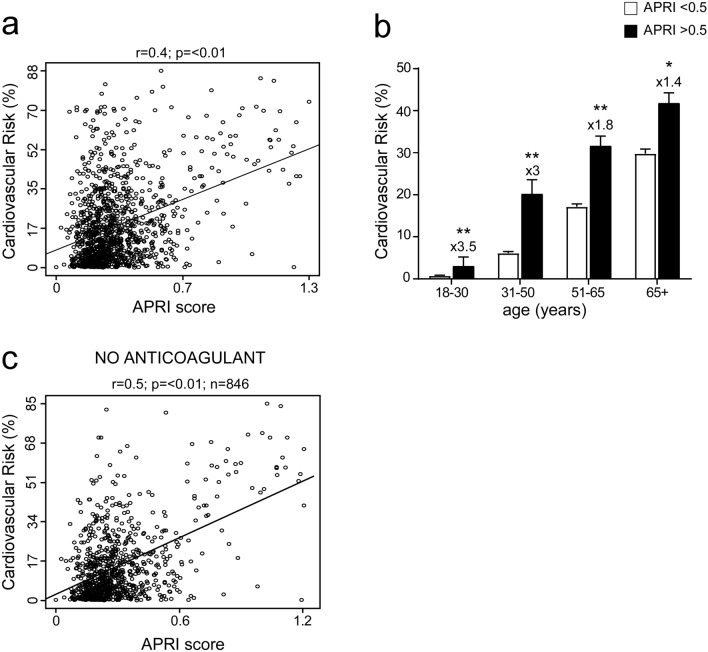
Figure 3.
Correlation between APRI score and cardiovascular risk in general population and classification by age. (a) Correlation analysis of APRI and cardiovascular risk (CVR) in the entire study population. (b) Classification of entire study population in age ranges; subjects were divided by APRI levels with a cut-off of 0.5 to identify elevated APRI. Data is presented as mean ± SEM. Statistical significance was assessed by Student T-test (*p < 0.05, **p < 0.01). Multipliers are shown to identify difference in CVR in subjects with APRI > 0.5 compared to subjects with APRI < 0.5 of the same age. (c) Correlation of APRI and CVR after removal of patients ongoing anticoagulant or antiplatelet treatment.

