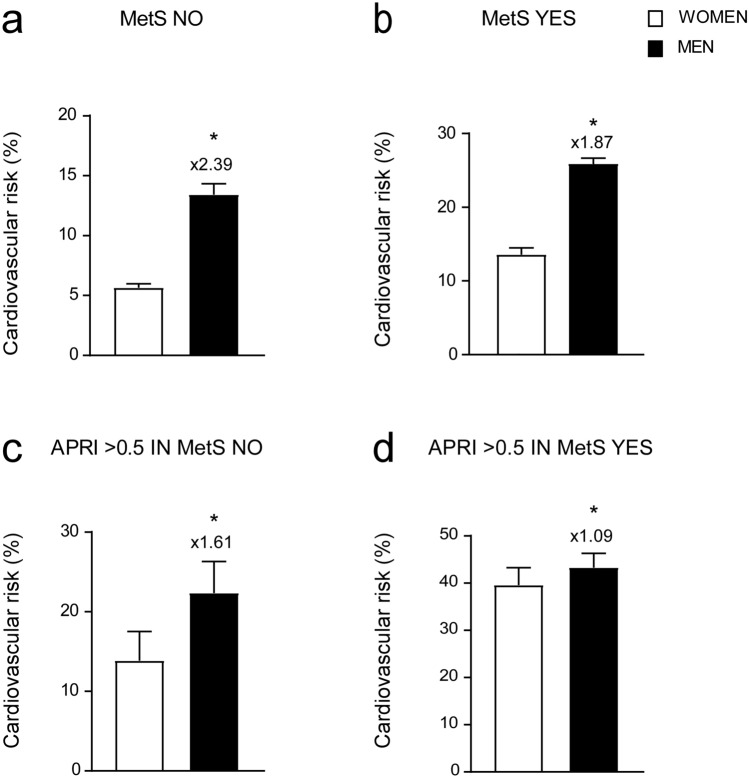
Figure 5.
Gender-based comparison of cardiovascular risk in different groups. (a–d) T-Test comparison of CVR in non-metabolic (MetS NO) (a), MetS (MetS YES) (b), non-metabolic (MetS NO) with APRI > 0.5 (c) and MetS (MetS YES) subjects with APRI > 0.5 (d). Subjects were divided based on gender. Data is presented as mean ± SEM. Statistical significance was assessed by Student T-test (**p < 0.01). Multipliers are shown to identify difference in CVR in males compared to females.

