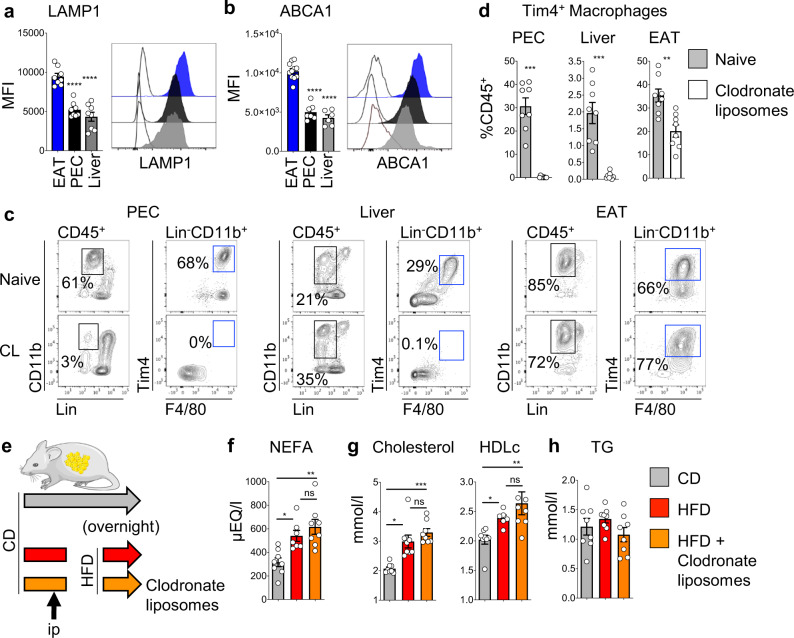
Fig. 7. Depletion of liver and peritoneal macrophages does not alter post-prandial cholesterol metabolism.
a, b Quantification of lysotracker (a) and ABCA1 (b) mean fluorescence intensity (MFI) and representative histogram of the fluorescence intensity for Tim4+ macrophages in the epididymal AT (EAT), peritoneal cavity exudate cells (PEC), and liver (gating shown in c). c, d Flow cytometric analysis showing gating strategy (c) used to quantify the percentage of Tim4+ macrophages (d) present in the PEC, liver, and EAT of naive mice (gray bar) and mice that received clodronate liposomes 24 h prior to analysis (white bar). Data are pooled from n = 8 mice per group from 2 independent experiments. e Mice were kept on chow diet or fed with a HFD overnight. One group of mice fed a HFD were injected i.p. with clodronate liposomes 24 h prior to the overnight HFD. f–h Circulating levels of NEFA (f), total cholesterol and HDLc (g), and TG (h) in mice kept on CD (gray bar), mice fed overnight with HFD (red bar), and mice fed overnight with HFD and injected with clodronate liposomes (orange). Data are pooled from n = 7 or 8 mice per group from 2 independent experiments. Error bars show SEM. Kruskal–Wallis test with Dunn’s multiple comparisons test or ANOVA with Sidak’s multiple comparisons test were applied after assessing normality using D’Agostino and Pearson Normality test. Significant differences are indicated by *P < 0.05, **P < 0.01, ***P < 0.001, ****P < 0.0001, ns = non-significant.

