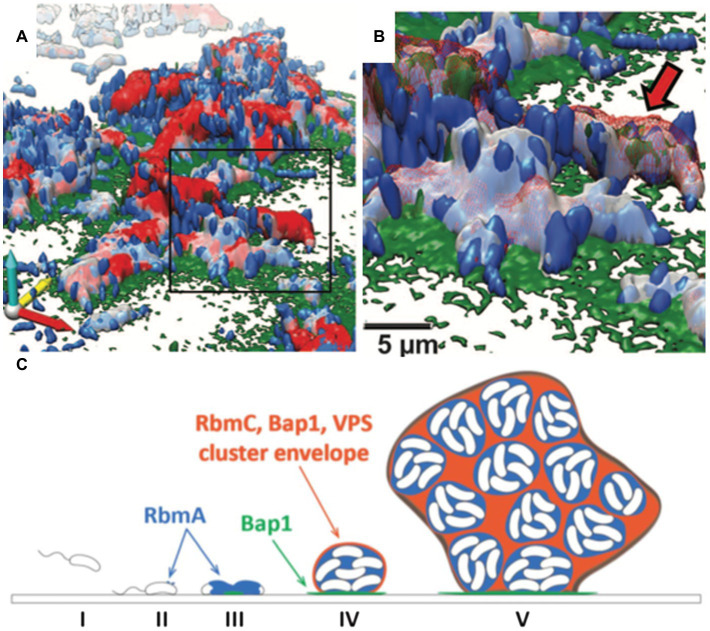
Figure 4.
The V. cholerae biofilm structure. (A) Three-dimensional architecture of a V. cholerae biofilm obtained through high-resolution SCLM. Images are pseudocolored in blue (cells), gray (RbmA), red (RbmC), and green (Bap1). RbmA localizes around and within the cell cluster, whereas Bap1 and RbmC encase the cell clusters. The Bap1 signal is also concentrated at the biofilm-substratum interface. (B) Enlargement of the box region in (A). The red arrow indicates one cell cluster. (C) Proposed model of biofilm development in V. cholerae. This figure is adapted with permission from Berk et al. (2012).

