Figure 6.
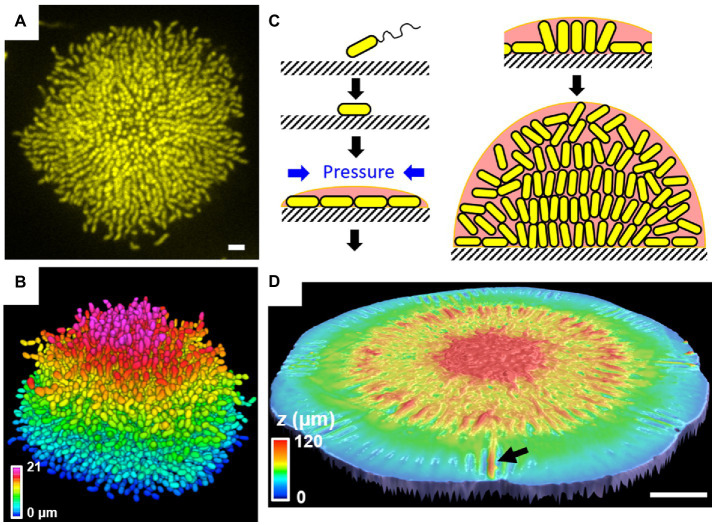
Single-cell live imaging of V. cholerae biofilms. (A) Cross-sectional image of the bottom cell layer of a growing V. cholerae biofilm cluster at 18 h and (B) the corresponding segmented image with color coding according to the z position. Scale bar: 3 μm. (C) Schematic model of the V. cholerae biofilm growth process. (D) Surface topography of a V. cholerae colony biofilm grown on 0.5% agar at the onset of the wrinkling-to-delamination transition (36 h). The arrow indicates a delaminated blister. Scale bar: 2 mm. Panels (A–C) are adapted with permission from Yan et al. (2016); panel (D) is adapted with permission from Yan et al. (2019).

