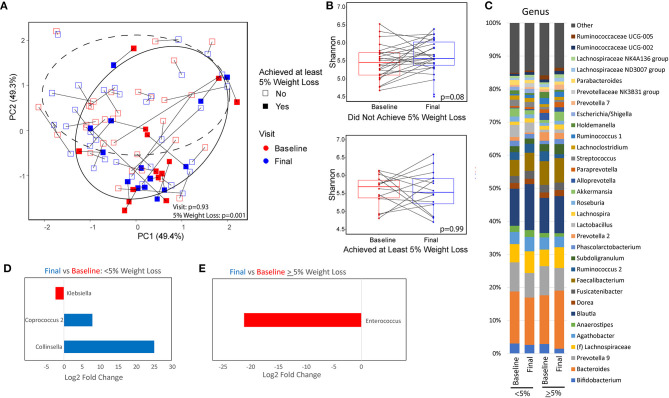
Figure 2.
Microbiome differences between baseline and after a calorie-restricted diet by weight loss category. (A) Principal coordinate analysis plot using the Robust Aitchison distance metric colored by visit with different shapes and 95% confidence interval ellipses corresponding to the amount of weight loss. Dashed ellipse encircles those that did not achieve at least 5% weight loss. Solid ellipse encircles those that did achieve at least 5% weight loss. (B) Microbial diversity as measured by Shannon index (measurement of species richness and evenness) between baseline and end of study, stratified by weight loss. (C) Taxonomic summary plots of genera stratified by timepoint and weight loss. Only genera with at least 1% relative abundance are listed. (D,E) Genera that are differentially abundant between baseline and week 16 for patients with (D) minimal weight loss and those with (E) at least 5% weight loss. Red indicates genera that are overabundant at baseline and blue indicates genera that are overabundant at the final visit. Magnitude of difference is represented as the log 2 of the fold change estimated from DESeq2 models.

