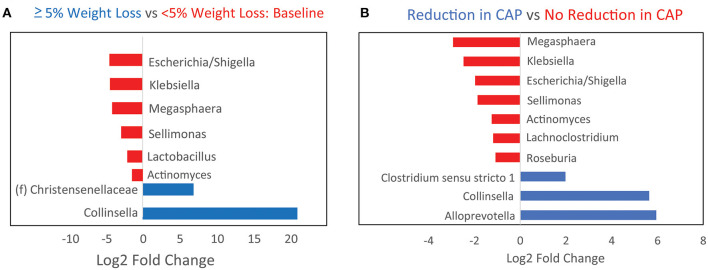
Figure 3.
Baseline microbiome differences between patients stratified by whether they achieved at least 5% weight loss or a reduction in hepatic steatosis on a calorie-restricted diet. (A) Bar plots showing baseline genera differences from DESeq2 analysis between patients who developed at least 5% weight loss as compared to those that did not. Red indicates genera that are overabundant in patients with <5% weight loss. (B) Baseline genera differences between patients who had reduction in hepatic steatosis by CAP score as compared to those that did not. Red indicates genera that are overabundant in patients that did not have any reduction in steatosis.

