Figure 5.
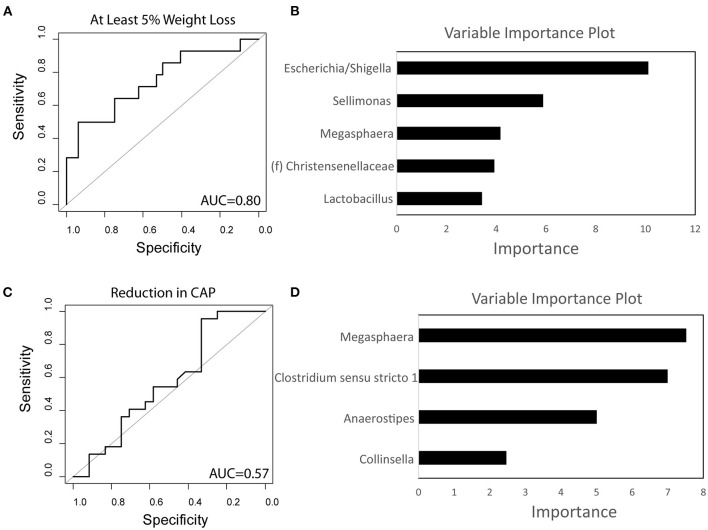
Baseline microbiome predicts weight loss on a calorie-restricted diet. (A) Receiver operating characteristic curve of the random forest classifier using baseline microbiome data to predict at least 5% weight loss. (B) Variable importance plot of the classifier for weight loss. (C) Receiver operating characteristic curve of the random forest classifier using baseline microbiome data to predict reduction in hepatic steatosis as measured by controlled attenuated parameter (CAP). (D) Variable importance plot of the classifier for steatosis. AUC, Area under the curve.

