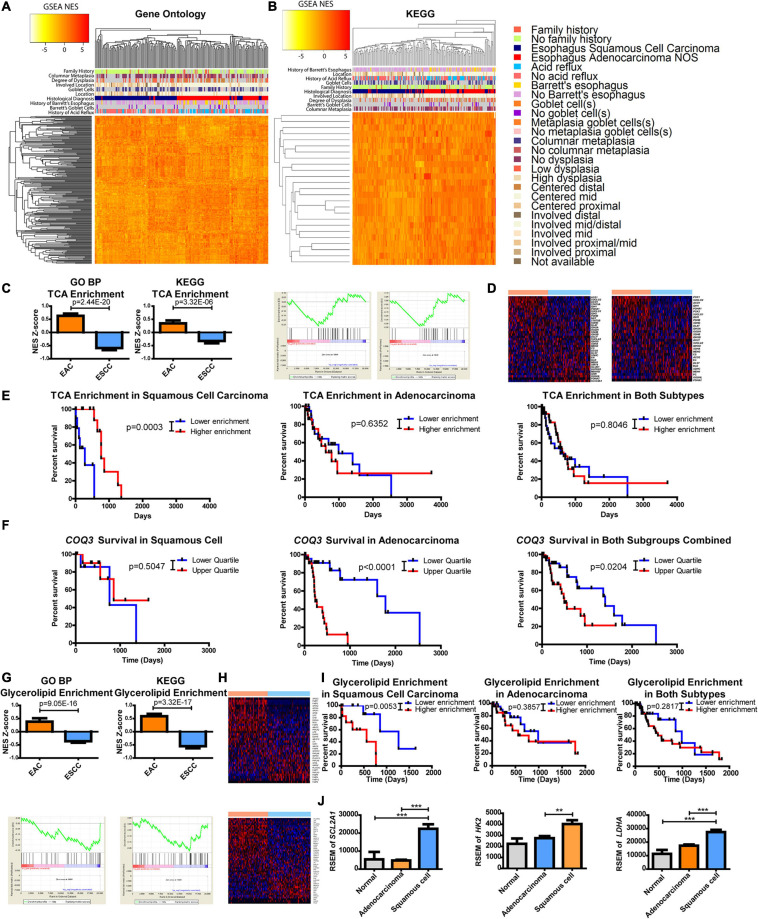
FIGURE 3.
Metabolic pathways are altered between esophageal squamous cell carcinoma (ESCC) and esophageal adenocarcinoma (EAC). Gene set enrichment analysis (GSEA) compared each patient against the average of normal tissues. Normalized enrichment scores (NESs) were plotted and hierarchically clustered for metabolic pathways, defined as ≥10 minimum enzymes with a minimum of 90% of enzymes, for (A) all Gene Ontology (GO) classifications and (B) metabolic pathways within the Kyoto Encyclopedia of Genes and Genomes (KEGG). (C) Each patient’s NES (top) and group average (bottom) for the tricarboxylic acid (TCA) cycle from GO biological process (BP) (left) and KEGG (right) (D) along with the heatmaps of the comprising genes within the pathway of GO (top) and KEGG (bottom). (E) Patient survival was plotted by separating the upper and lower quartiles of TCA NES through KEGG’s pathway for ESCC (left), EAC (middle), and both (right). (F) Patient survival was plotted by separating the upper and lower quartiles of COQ3 expression in ESCC (left), EAC (middle), and both (right). (G) Each patient’s NES (top) and group average (bottom) for glycerolipid enrichment from GO BP (left) and KEGG (right) (H) with the heatmaps of the comprising genes within the pathway of GO (top) and KEGG (bottom). (I) Patient survival was plotted by separating the upper and lower quartiles of glycerolipid NES through KEGG’s signature for ESCC (left), EAC (middle), and both (right). (J) Gene expression within each subtype. Pathway enrichment significance was calculated by a Student’s t-test, Mantel–Cox log-rank for survival, and gene expression was compared with a one-way ANOVA with a Bonferroni’s multiple comparison test. **p < 0.01, ***p < 0.001.

