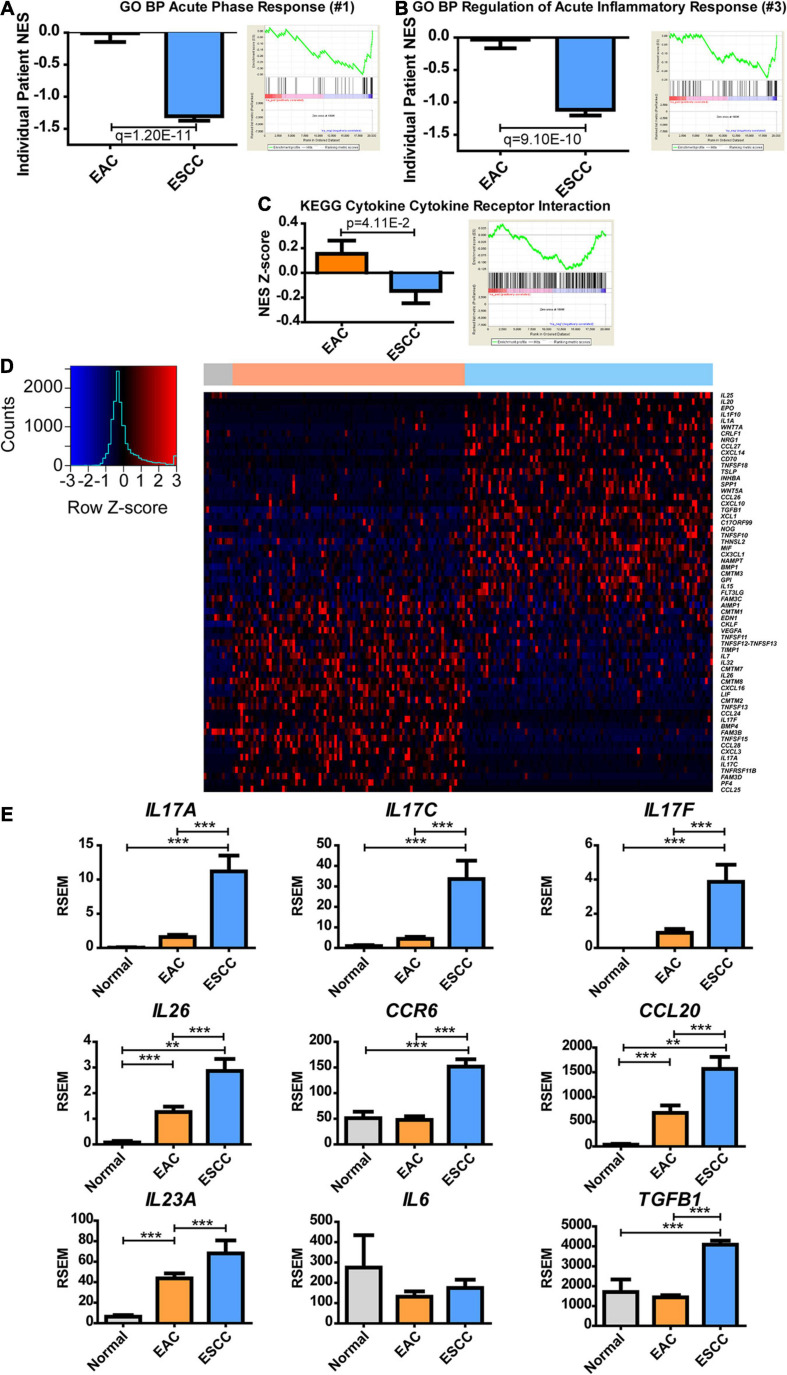
FIGURE 4.
Esophageal squamous cell carcinoma (ESCC) and esophageal adenocarcinoma (EAC) histological subtypes show distinct inflammatory responses. Normalized enrichment score (NES) was calculated for each patient’s tumor by comparing each patient’s expression to the normal adjacent tissue average expression (left) and as a group against the average of each subtype (right) for Gene Ontology biological processes (GO BPs). (A) The largest fold change of ESCC compared to EA was discovered to be acute phase response, (B) while the third was regulation of acute inflammatory response. (C) The same calculation was made for the Kyoto Encyclopedia of Genes and Genomes (KEGG) database to show the NES Z-score (left) and average group enrichment (right). (D) Heatmap mRNA Z-scores of differentially expressed genes (Student’s t-test, p < 0.05) for GO term “cytokine activity” (GO: 0005125). The color bar on top indicates normal (gray), EAC (orange), and ESCC (blue). (E) mRNA expression levels for cytokines of interest relating to a Th17 signature. Differences in enrichment scores were calculated by the Student’s t-test and corrected with a Benjamini–Hochberg correction when examining multiple pathways in GO. Gene expression was compared with Kruskal–Wallis H test with Dunn’s multiple comparison test between all columns. **p < 0.01, ***p < 0.001.

