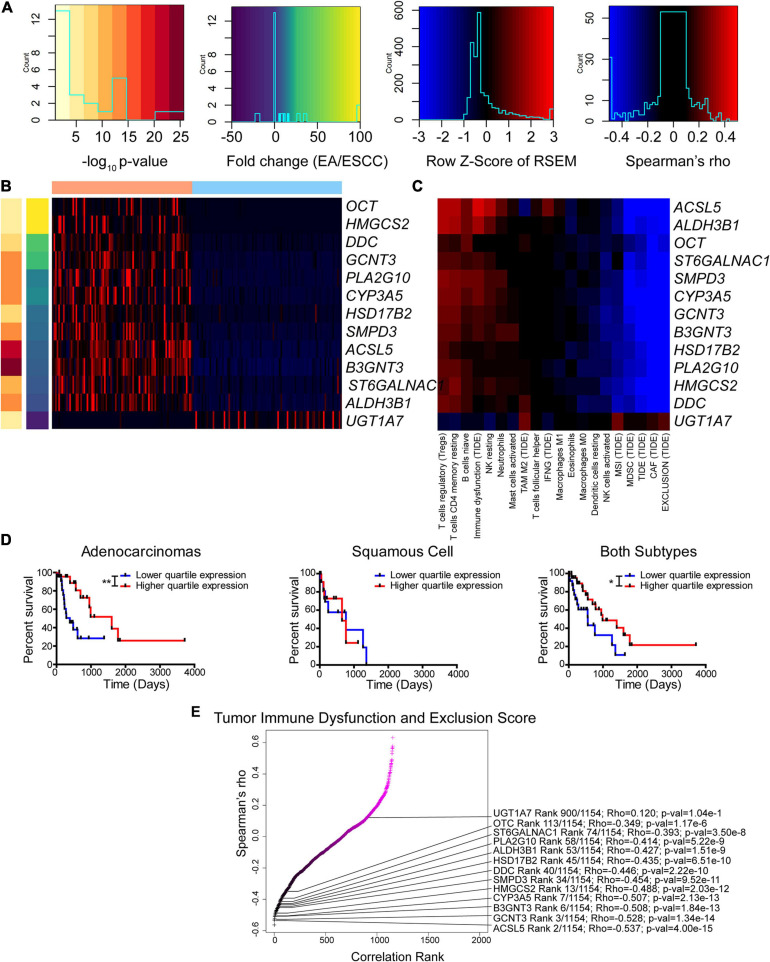
FIGURE 6.
Enzyme expression correlates with immune function prediction. (A–C) Legends (A) for Z-score of differentially expressed enzymes between subtypes (B) and Spearman’s rho for correlation between expression and immune function prediction from CIBERSORT and Tumor Immune Dysfunction and Exclusion (TIDE) utilizing both subtypes (C). (D) Kaplan–Meier survival curves for ALDH3B1. (E) Ranked Spearman’s rho correlation between enzyme mRNA and TIDE score for tumor immune dysfunction and exclusion utilizing both subtypes. Survival statistics utilized Mantel–Cox log-rank. *p < 0.05, **p < 0.01.

