
FIGURE 3.
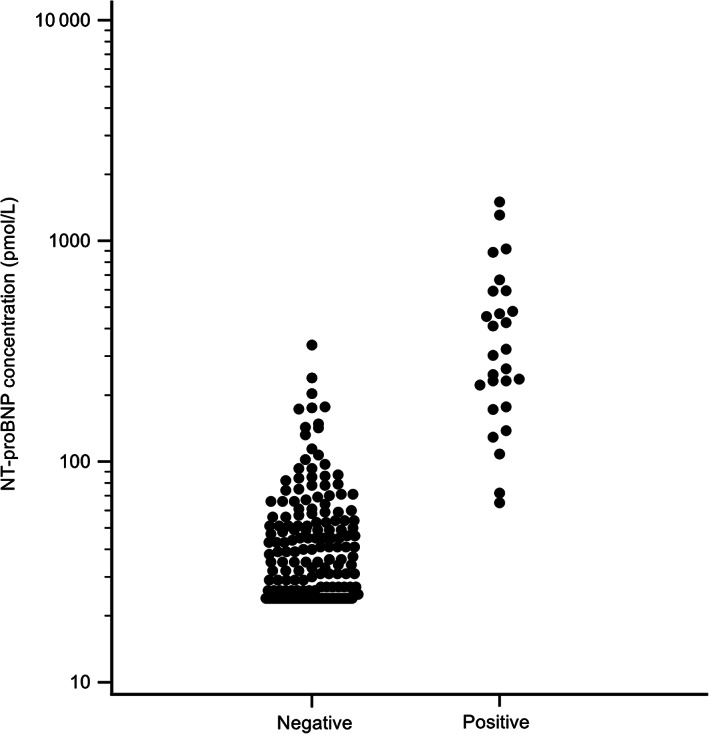
Quantitative NT‐proBNP concentrations in cats with either a positive or a negative POC NT‐proBNP ELISA result. Note the use of a log scale on the y‐axis
Official websites use .gov
A
.gov website belongs to an official
government organization in the United States.
Secure .gov websites use HTTPS
A lock (
) or https:// means you've safely
connected to the .gov website. Share sensitive
information only on official, secure websites.
Quantitative NT‐proBNP concentrations in cats with either a positive or a negative POC NT‐proBNP ELISA result. Note the use of a log scale on the y‐axis