
FIGURE 4.
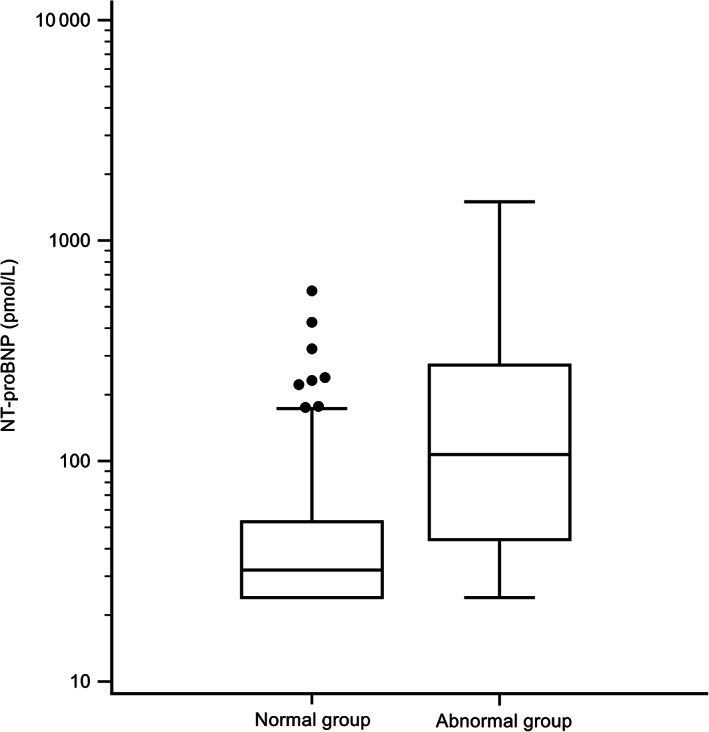
Box and whisker plot of NT‐proBNP concentrations in the normal group and the abnormal group. Note the use of a log scale on the y‐axis
Official websites use .gov
A
.gov website belongs to an official
government organization in the United States.
Secure .gov websites use HTTPS
A lock (
) or https:// means you've safely
connected to the .gov website. Share sensitive
information only on official, secure websites.
Box and whisker plot of NT‐proBNP concentrations in the normal group and the abnormal group. Note the use of a log scale on the y‐axis