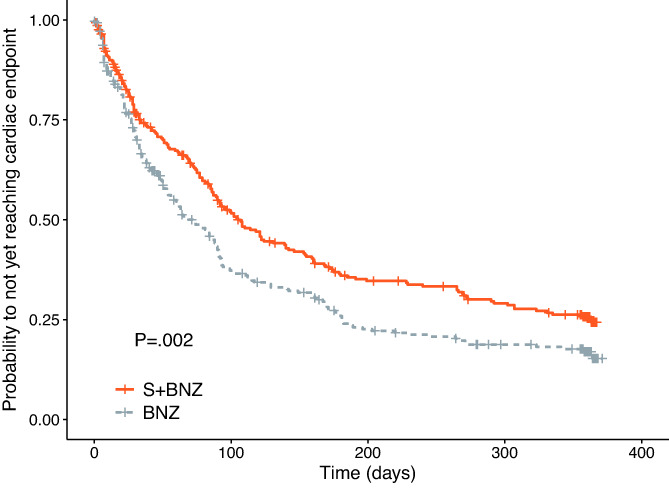
FIGURE 5.

Kaplan‐Meier survival curves displaying the probability of not yet reaching the cardiac endpoint in the S+BNZ group (orange solid line) vs the BNZ group (gray dotted line). There were 284 dogs in the S+BNZ group and 285 dogs in the BNZ group at the outset (safety sample). Cross marks represent censored observations
