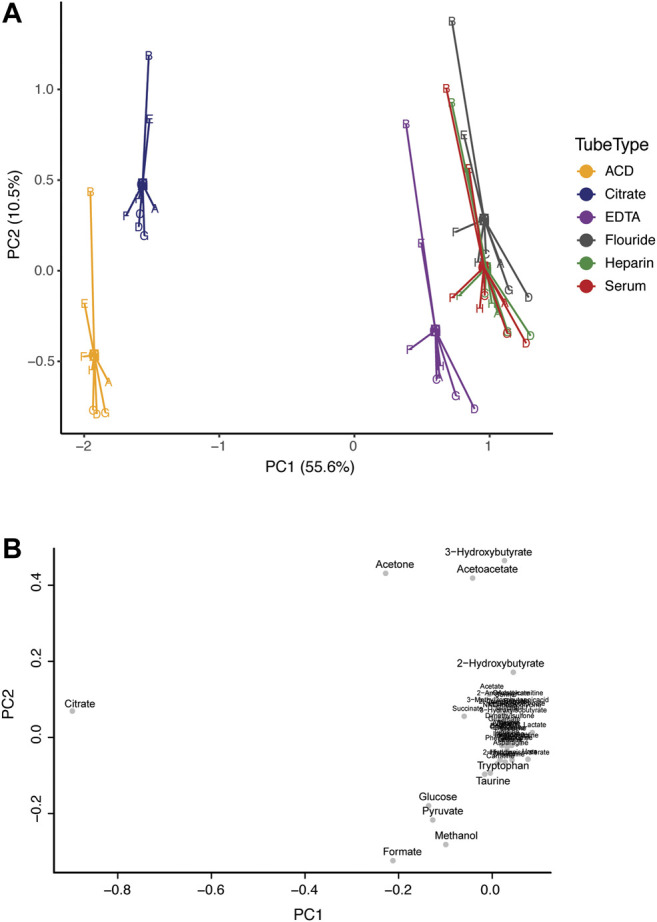
FIGURE 1.

Comparison of the metabolic profile in serum and plasma samples from eight individuals. Subjects are represented by letters (A–H), and color indicates tube-type according to the legend (A) Principal component analysis (PCA) centroid plot of samples and (B) the corresponding loadings plot.
