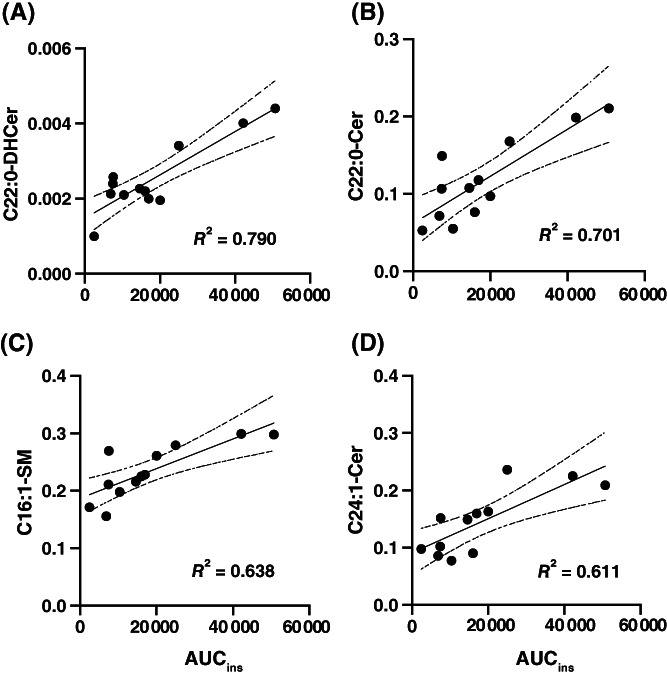
FIGURE 7.

The simple linear regression of sphingolipids measured at 0 minute, with AUCins during the oral glucose test. A, C22:0‐DHCer; B, C22:0‐Cer; C, C16:1‐SM; D, C24:1‐Cer. AUC, area under the curve; Cer, ceramide; DHCer, dihydroceramide; SM, sphingomyelin
