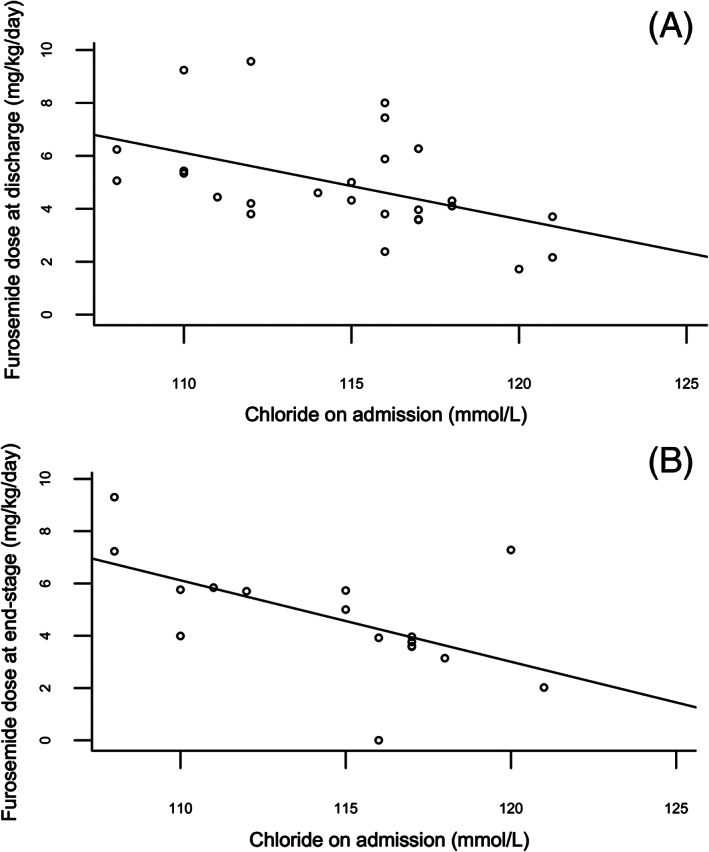
FIGURE 2.

Scatter plot demonstrating correlation between serum chloride concentration on admission (mmol/L) and furosemide dose (mg/kg/day) in furosemide‐naïve dogs at discharge (A) and at end‐stage (B). The full line represents the linear association between chloride on admission (independent variable) and Y (depending on the graph, dependent variable) found with a simple linear model
