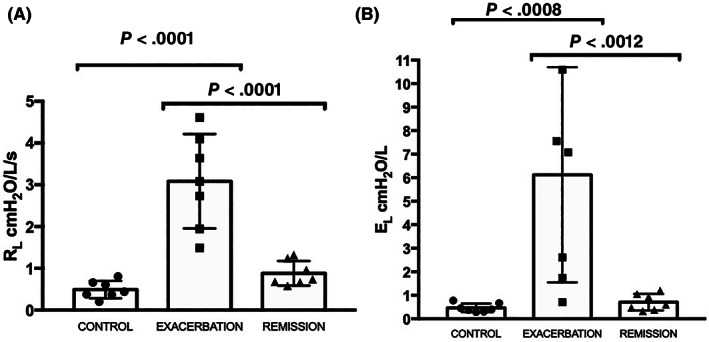
FIGURE 3.

(A) Pulmonary resistance (RL) and (B) pulmonary elastance (EL) measured in control (n = 7) and asthmatic horses in exacerbation (n = 7) and remission (n = 7). The error bars indicate the standard deviation of the mean. Significantly higher RL and EL values were observed in horses in exacerbation when compared with control (P < .0001, P = .0008, respectively) and remission (P < .0001, P = .0012, respectively)
