
FIG. 2.
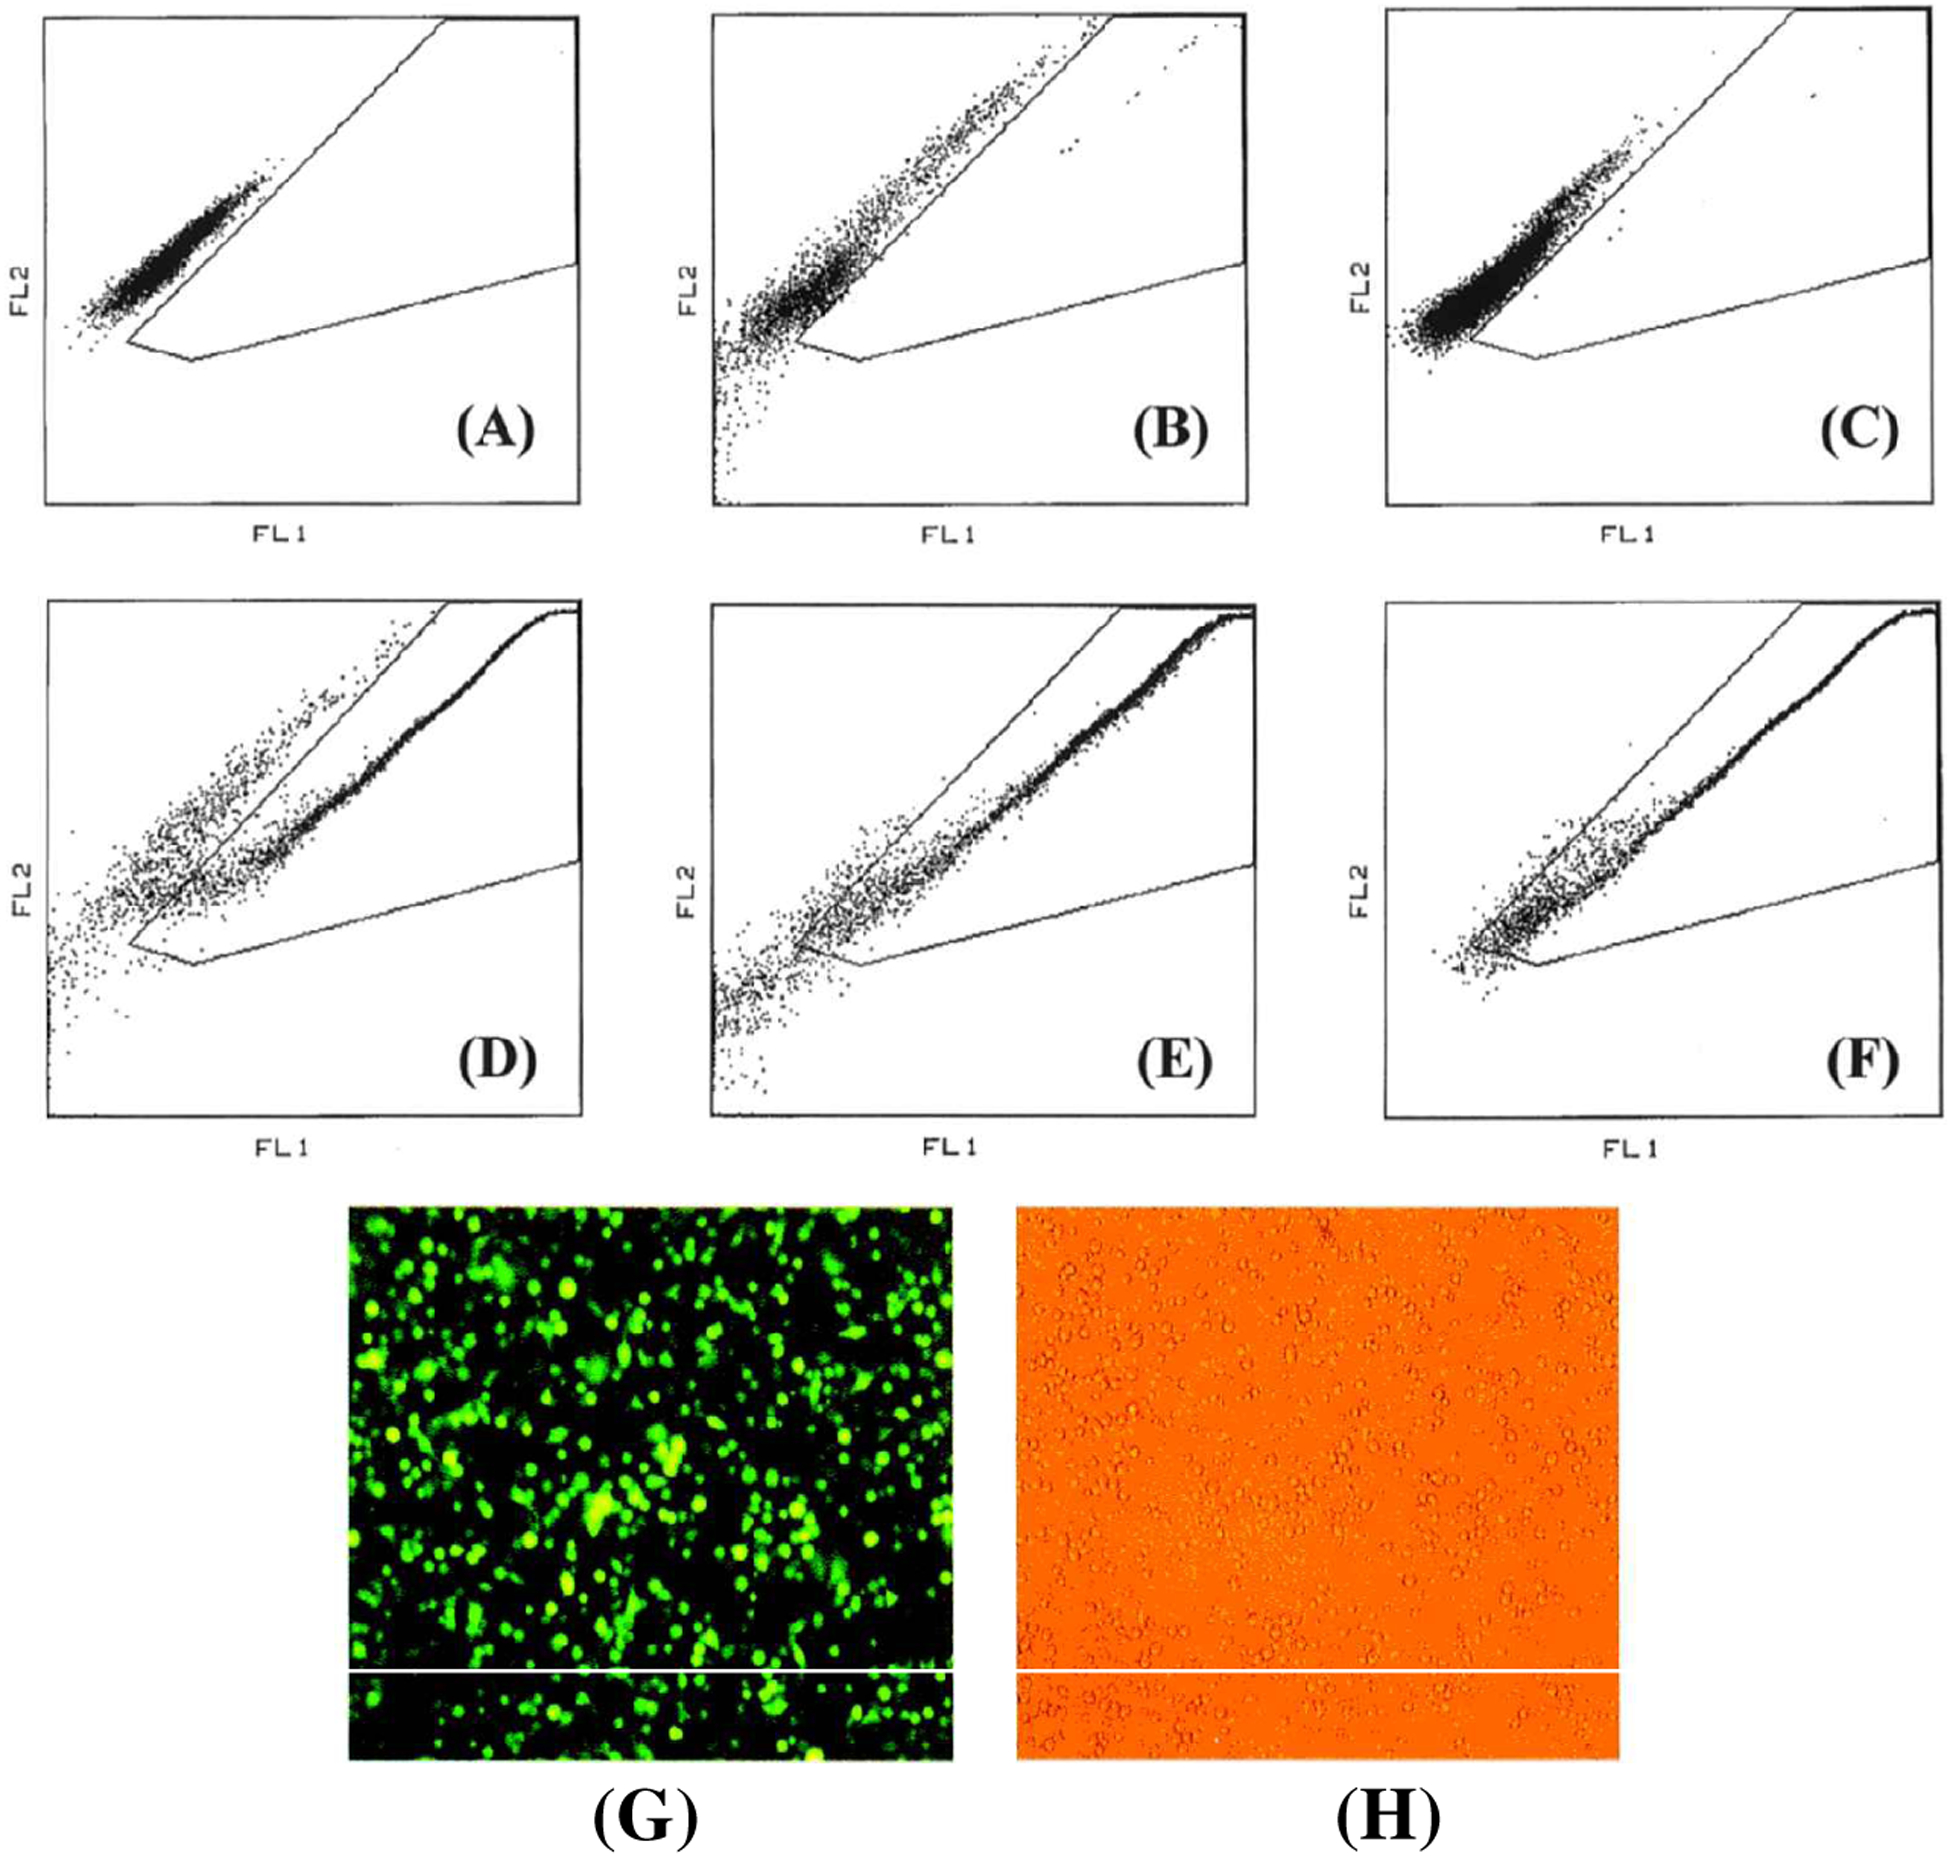
FACS analysis of ACE-GFP-transduced versus RDR-GFP-transduced subcutaneous gliomas. The indicated gate is calibrated for GFP-positive events, which deviate more toward the green fluorescence (FL1) channel (x axis) and away from the red (FL2) channel (y axis). (A) Untransduced control U-87 cells; (B) U-87 tumor, 2 weeks postinfection with RDR-GFP, shows 1.2% GFP+ cells; (C) U-87 tumor, 6 weeks postinfection with RDR-GFP, shows 0.2% GFP+ cells; (D) U-87 tumor, 2 weeks postinfection with ACE-GFP, shows 70.6% GFP+ cells; (E) U-87 tumor, 4 weeks postinfection with ACE-GFP, shows 90.2%GFP+ cells; (F) U-87 tumor, 6 weeks postinfection with ACE-GFP, shows 97.2% GFP+ cells. (G and H) Fluorescence (G) and visible light (H) micrographs of U-87 subcutaneous glioma cells immediately after tumor dissection and cell disaggregation, 4 weeks posttransduction, showing almost 100% transduction with GFP.