Figure 1.

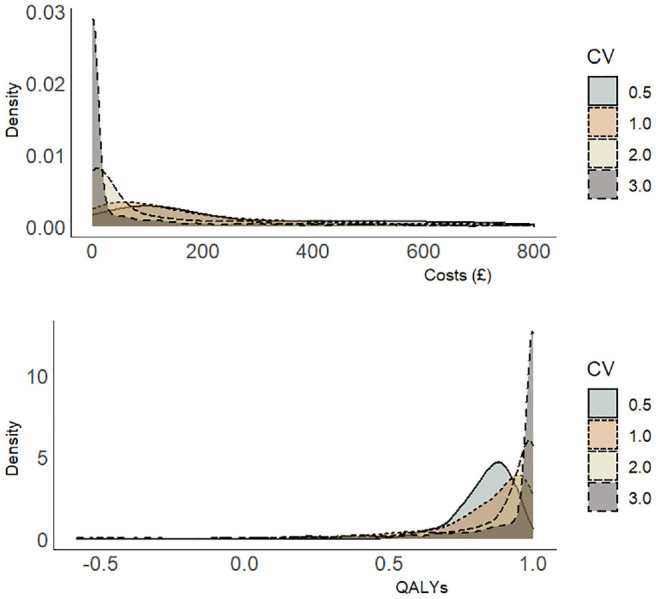
Simulated distribution of costs and quality-adjusted life-years for different coefficients of variation (CVs) defined as the ratio of the standard deviation to the mean.

Simulated distribution of costs and quality-adjusted life-years for different coefficients of variation (CVs) defined as the ratio of the standard deviation to the mean.