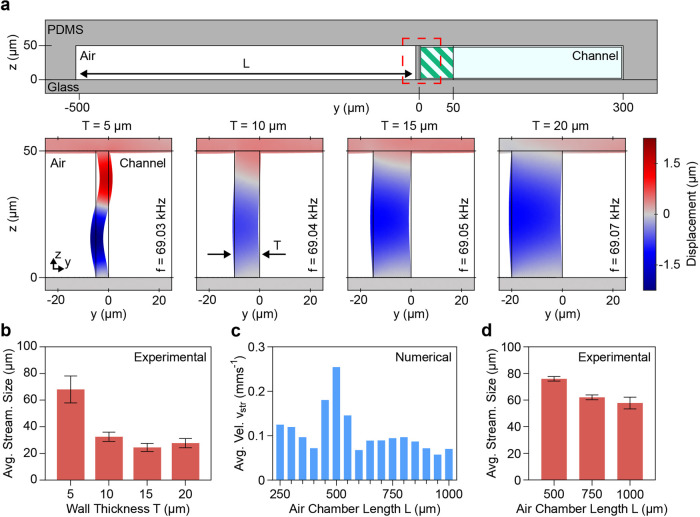
Figure 2.
Design optimization with numerical and experimental investigations. (a) Numerical model of the device’s yz-plane zoomed in to highlight the embedded microbubble and water channel. The region of interest, containing the thin PDMS wall, is highlighted with a red square. The green hatched area near the PDMS wall inside the fluid channel denotes the area used for the numerical evaluation of the average acoustic energy density Eac as well as the average streaming velocity vstr. The wall displacement for varying wall thicknesses T = 5–20 μm have been derived through numerical simulations. While thinner walls lead to stronger displacements, similar resonance frequencies of the thicker walls have been observed, indicating that the resonance of the bubble dominates. (b) Experimentally determined in-plane streaming sizes (in y-direction) for different wall thicknesses T with a constant air chamber length L = 500 μm. The largest streaming pattern has been observed for a wall thickness of T = 5 μm. (c) Numerical results for the average streaming velocity vstr at the resonance frequency for air chamber lengths L = 250–1000 μm with a constant wall thickness T = 5 μm. The maximum average streaming velocity in the area close to the vibrating wall is achieved for an air chamber length of L = 500 μm. (d) Experimental results of the in-plane streaming size for different air chamber lengths L and a constant wall thickness T = 5 μm. The experimental results nicely fit the findings of the numerical investigations, indicating that L = 500 μm leads to the largest streaming vortices.

