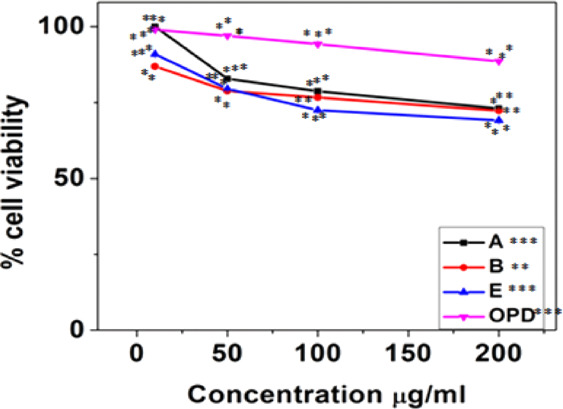
Figure 8.

MTT assay in the L6 cell line study with three gold nano-bioconjugates A, B, and E. Data represents the results of experiments done in triplicates, n = 3. Values are the mean ± standard deviation of three independent experiments. The statistical significance of the difference between treated and control groups was analyzed using one-way ANOVA followed by all pairwise multiple comparison procedures (Student–Newman–Keuls method). An asterisk (*) represents a significance difference when compared to control values at *p < 0.05 (*p < 0.05; **p < 0.01; ***p < 0.001).
