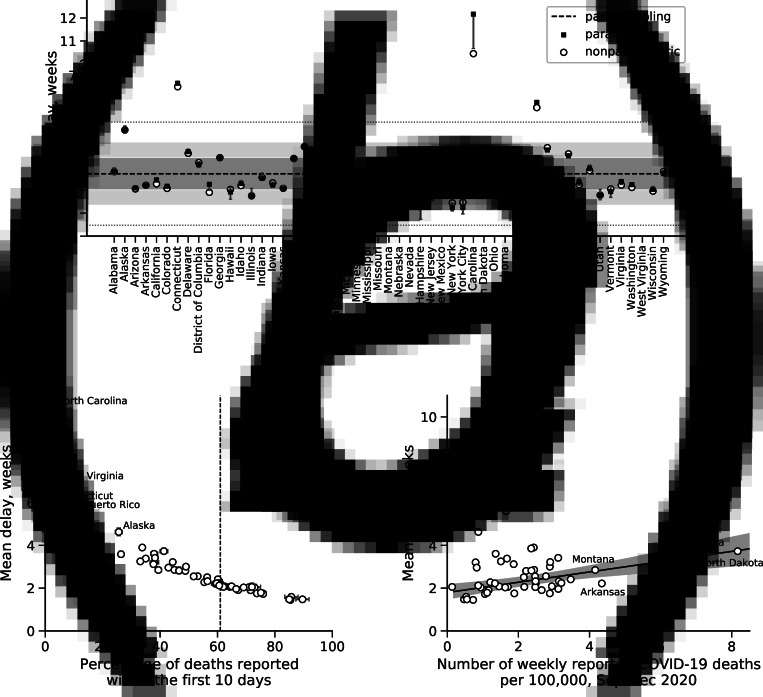
Fig. 1.
(a) Mean reporting delay by jurisdiction using different estimation approaches (legend). Error bars indicate the 95% CI for individually estimated reporting delays using a parametric model. Dashed line indicates a common mean delay inferred from the partial pool model. The entire shaded area indicates the 95% CI for the common mean delay, whereas the dark shaded area covers the interquartile range of the posterior. (b) Relationship between the fraction of deaths reported within the first 10 days and the mean reporting delay by jurisdiction obtained from non-parametric estimation of the reporting delay distribution. Dashed line indicates an estimate of 61% cited in technical notes of CDC [5]. (c) Correlation between number of reported COVID-19 deaths per 100 000 from September to December 2020 and the mean reporting delay by jurisdiction. Solid line is obtained from a linear regression model. Shaded area indicates 95% CI.

