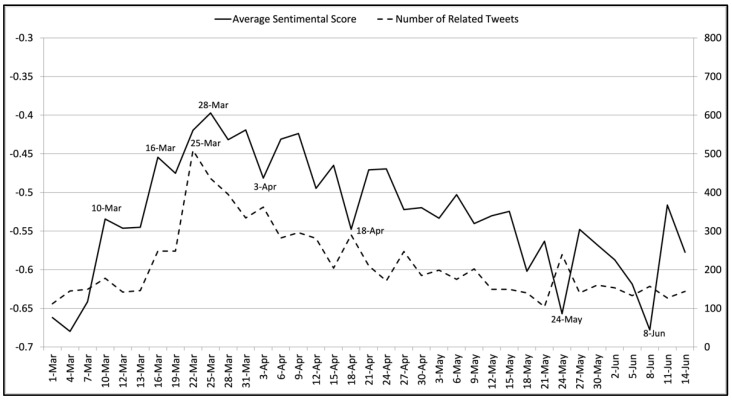
Figure 4.
The average sentiment scores and the numbers of tweets related to the stay-at-home policy on each collection day from 1 March 2020 to 14 June 2020. The left vertical axis indicates average sentiment scores, while the right vertical axis suggests the number of related tweets collected. The horizontal axis shows the collection dates.

