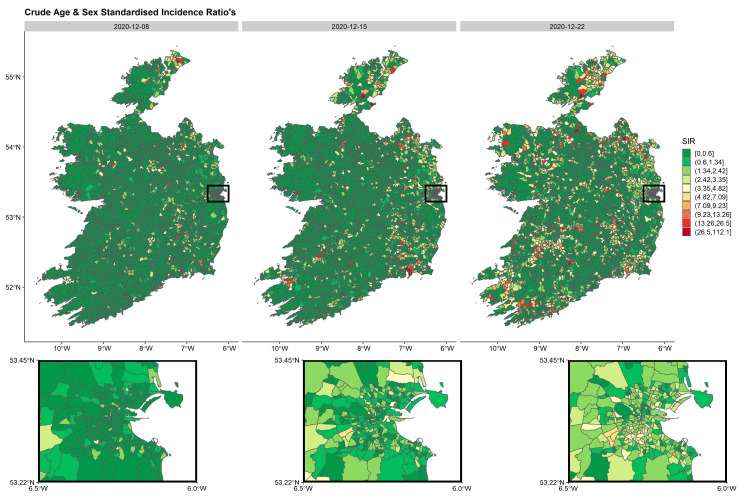
Figure 2.
Age- and sex-standardised incidence ratios’ (SIRs) by week per ED in Ireland during the first three weeks of wave 3 (8 December 2020–22 December 2020). The inset represents the greater Dublin area (capital of Ireland), where EDs are generally smaller in geographical size due to larger populations. The maps are standardised to the whole pandemic.

